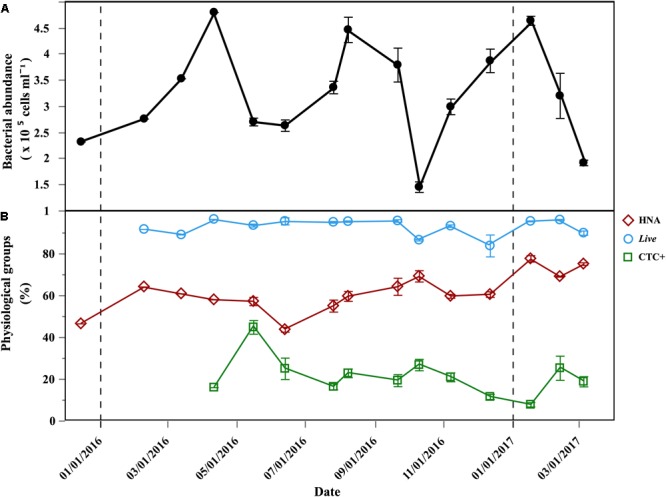
FIGURE 2.

Temporal distribution of bacterioplankton physiological groups at the beginning of the incubations. (A) Average (±SE) of initial total abundance (HNA + LNA) in the Community treatment; (B) average (±SE) percentages of: HNA, Live cells, CTC+ cells, in the Community treatment; vertical dash black lines represent the beginning of a new year.
