FIGURE 3.

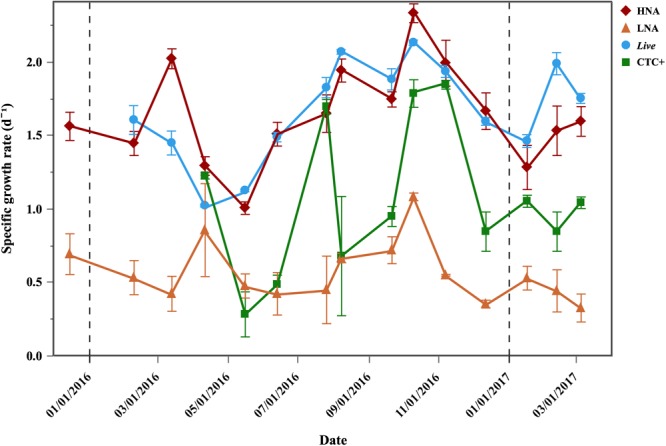
Temporal distribution of average (±SE) specific growth rates of bacterial physiological groups in the Filtered treatment. Vertical dash black lines represent the beginning of a new year.

Temporal distribution of average (±SE) specific growth rates of bacterial physiological groups in the Filtered treatment. Vertical dash black lines represent the beginning of a new year.