FIGURE 5.

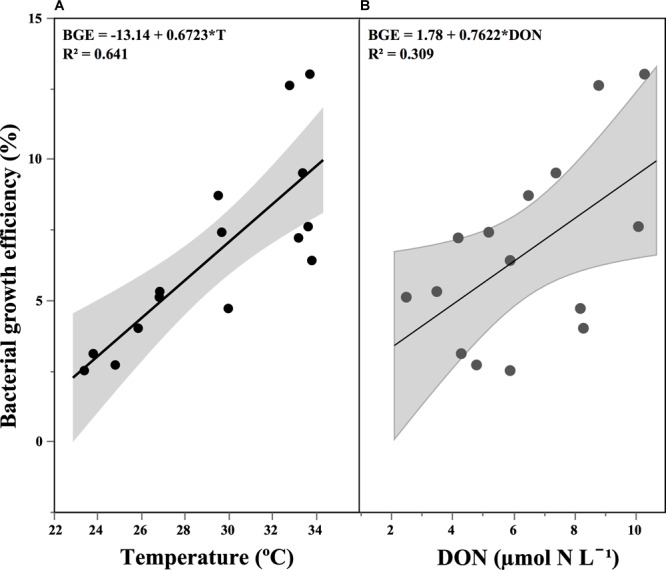
Relationship between bacterial growth efficiency and: (A) temperature and (B) dissolved organic nitrogen concentration (DON). The shaded area represents the confidence intervals (95%) for the fitted linear regression.

Relationship between bacterial growth efficiency and: (A) temperature and (B) dissolved organic nitrogen concentration (DON). The shaded area represents the confidence intervals (95%) for the fitted linear regression.