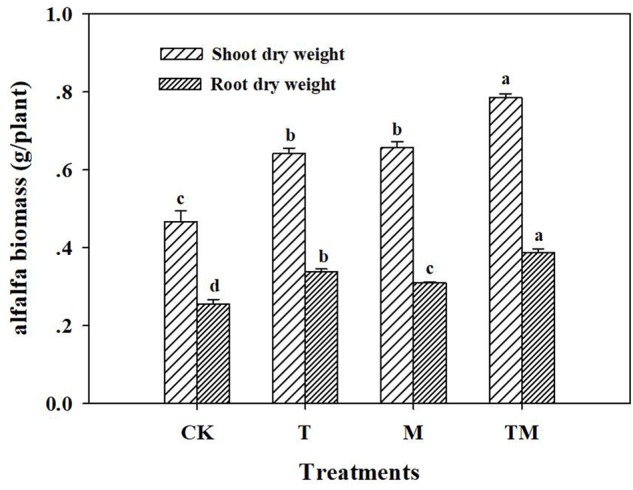
FIGURE 1.

Alfalfa biomass in different treatments. CK: no Trichoderma-inoculation and not mowed; T: Trichoderma-inoculation and not mowed; M: mowed and no Trichoderma-inoculation; TM: mowed and Trichoderma-inoculated. Bars above the histogram represent standard deviations and different letters indicate significant differences according to ANOVA test.
