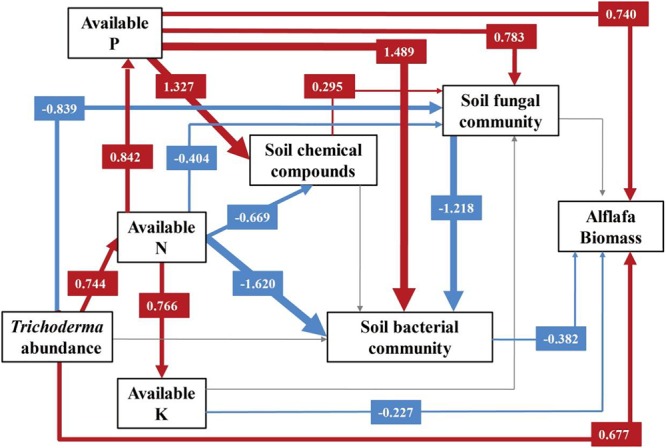
FIGURE 5.

Structural equation modeling (SEM) for alfalfa biomass. A path coefficient is analogous to a partial correlation coefficient and describes the strength and sign of the relationship between two variables. Negative pathways are shown as blue lines, positive pathways are shown as red lines, and line thickness represents the intensity of influence. Non-significant pathways are shown in gray. The models provided a good fit to our data. The model fits are given in Supplementary Table S3, and significance levels are provided in Supplementary Table S4.
