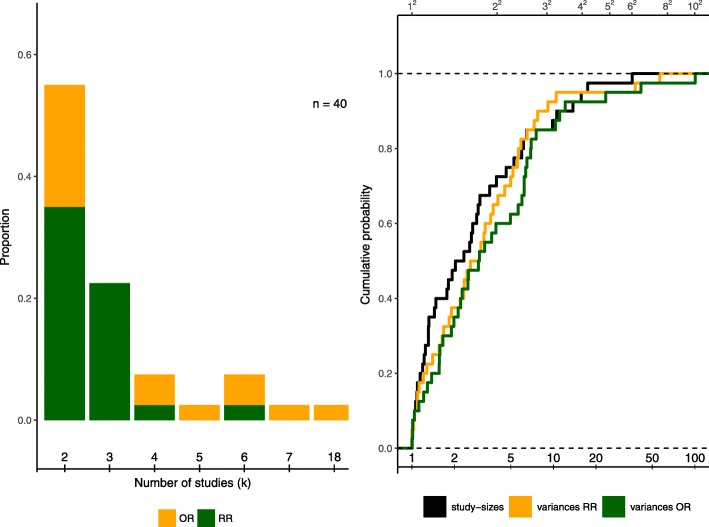
Fig. 1.
Characteristics of the data set extracted from IQWiG publications. Left side: Proportions of number of studies included per meta-analysis out of n = 40. Colours indicate the effect measure used in the original publications. Right side: Empirical distribution function for the proportion of study sizes (largest vs. smallest per meta-analysis, black) and the proportion of study-specific variances (largest vs. smallest per meta-analysis) for the log-transformed RR (green) and the log-transformed OR (orange). All meta-analyses are included for both effect measures

