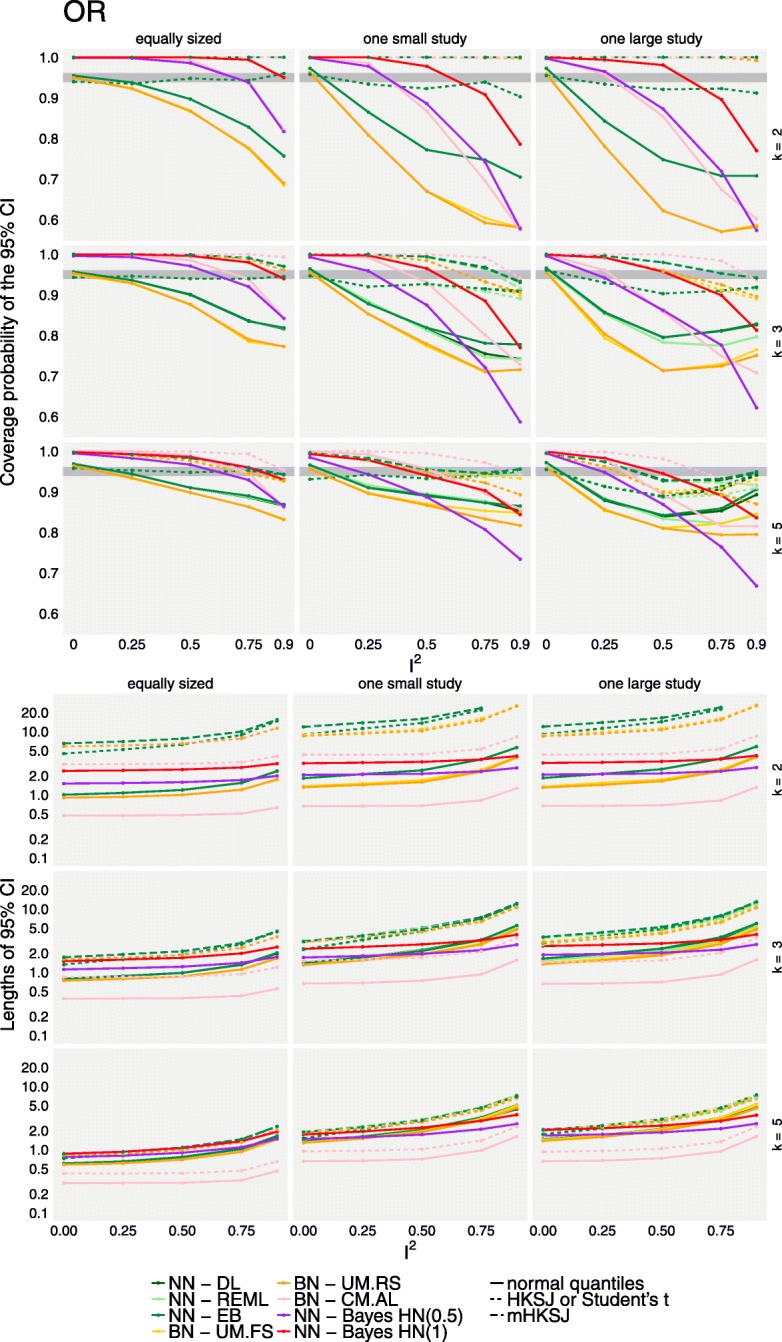
Fig. 5.

Coverage probabilities and lengths of 95% confidence or credible intervals for the overall effect for OR effects based on the simulated data. The top panel shows the coverage probabilities of treatment effect CIs for the different methods (colours) and adjustments (line types). The grey area indicates the range expected with 95% probability if the coverage is accurate. The bottom panel similarly shows the lengths of 95% confidence or credible intervals. Results are illustrated for a study size of ni = 100 and a baseline event probability p0 = 0.7, and are based on 2000 replications per scenario. CM.EL is omitted due to low convergence rates
