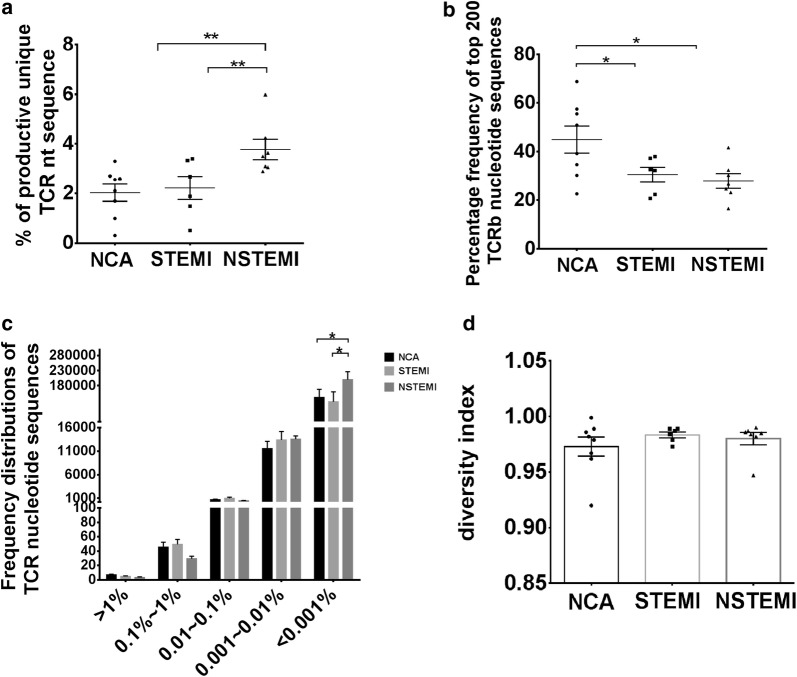
Fig. 1.
Clonal distribution of T cells in NCA controls and AMI patients. a Data show the percentage of productive unique TCR sequence in NCA controls and AMI patients. b Data show the frequency of top 200 T cell receptor repertoire nucleotide sequence in NCA controls and AMI patients. c Frequency distribution of TCR nucleotide sequence from NCA (n = 8) controls, NSTEMI (n = 7) and STEMI (n = 6) patients. d Data show the distribution of T-cell clonal frequencies through the measurement of amino acid diversity. Data are represented as mean ± SD of distribution of each patient and the bar shows the mean ± SD of the group. Each dot represents a patient’s information. The differences between groups were compared using t-test. **P < 0.01 and *P < 0.05. nt nucleotide

