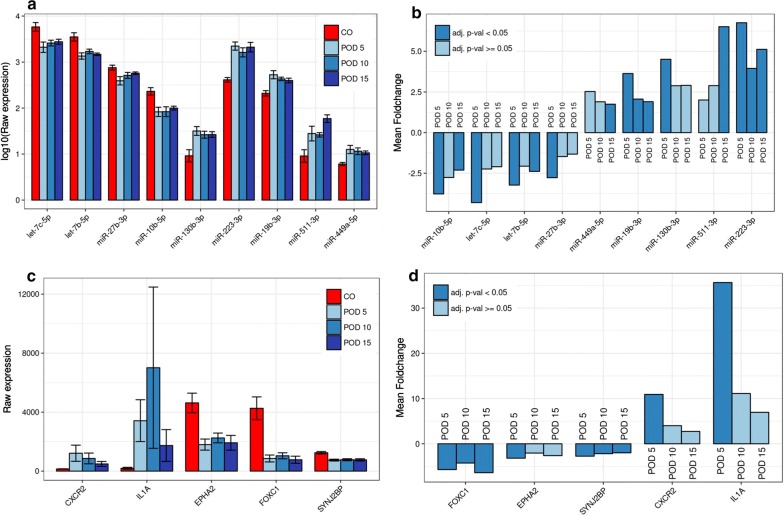
Fig. 4.
Differential expression of microRNAs and messenger RNAs with relevance to angiogenesis. Mean expression levels ± 1 SEM (a) and mean fold-changes (b) compared to controls (CO) for microRNAs (miRNAs) with significant inverse correlations and target interactions with messenger RNAs (mRNAs) (c, d) in the analyzed groups. Mean expression levels for miRNAs are shown log10-transformed for illustrative purposes

