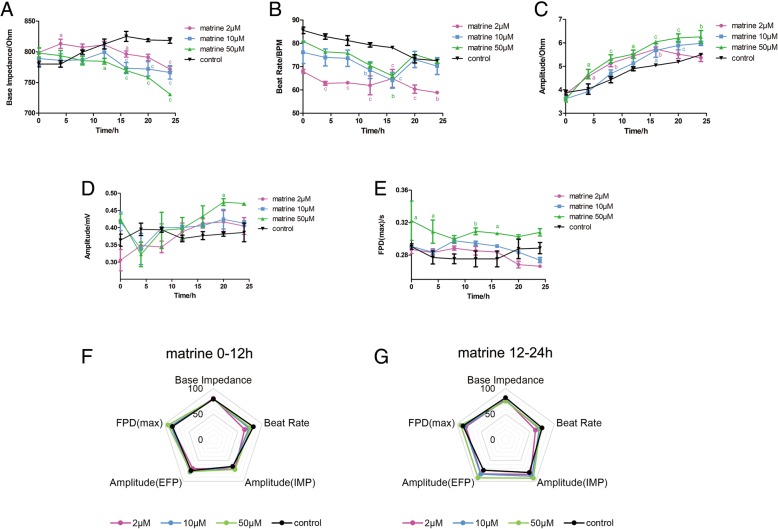
Fig. 3.
Effect of matrine on the impedance and EFP signal in hiPSC-CMs. The indicators include a base impedance, b beat rate, c amplitude of IMP, d amplitude of EFP, and e FPD (max). Comprehensive analysis of the above indicators is shown in spider charts in f 0–12 h and g 12–24 h. Data are presented as the mean ± SEM, n ≥ 3. aP > 0.05, bP > 0.01, and cP > 0.001 vs the control group, and the colors of the superscript letters are the same with the broken lines

