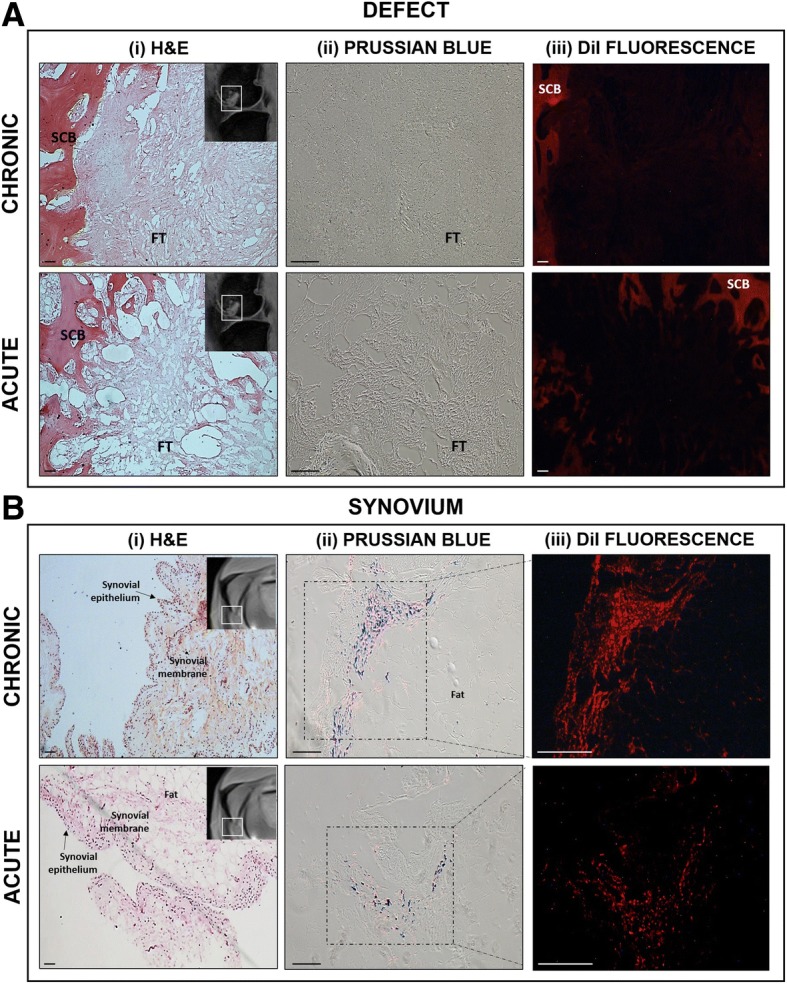
Fig. 7.

Representative tissue sections showing a the osteochondral defect and b the synovium from the injured leg (left leg) of both models. Tissue structure is shown by (i) H&E staining where connective tissue is depicted by pink whilst cellular matter is stained purple, insert; MR image depicting general location of histological section (defect and synovium). (ii) Prussian blue staining revealed the presence of iron oxide-based magnetic nanoparticle and is seen as blue staining. (iii) Fluorescent red staining represents delivered oMSCs stained with the membrane dye DiI prior to delivery. Scale bars = 100 μm. SCB = subchondral bone, FT = fibrous tissue
