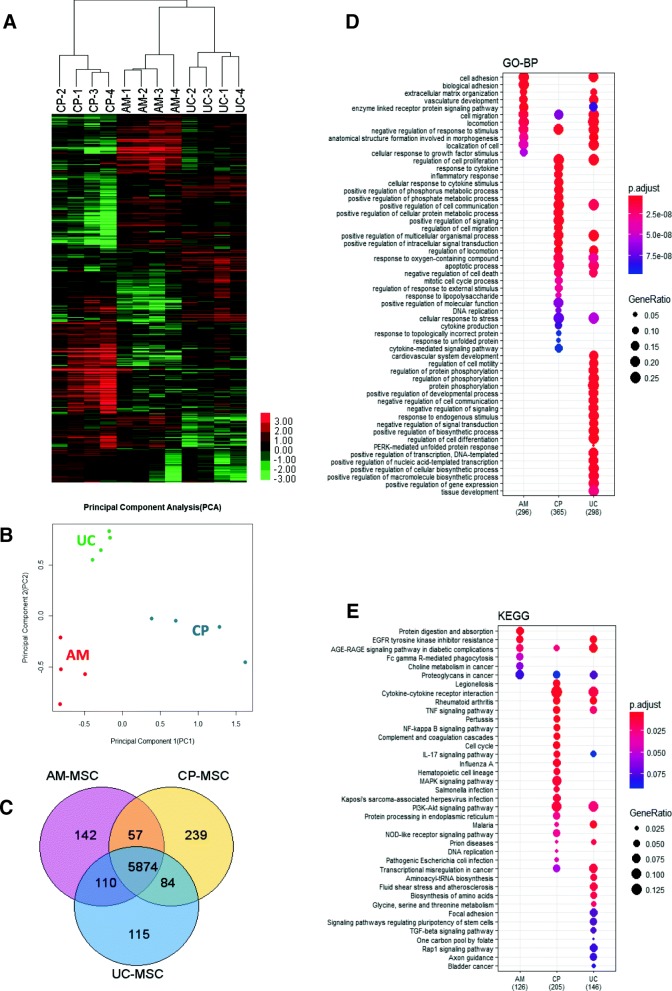
Fig. 5.
Transcriptional analysis of AM-MSCs, UC-MSCs, and CP-MSCs. Hierarchical clustering (a) and principal component analysis (b) showed a closer relationship between UC-MSCs and AM-MSCs, while CP-MSCs displayed a farther distance from UC-MSCs and AM-MSCs. c The number of differentially expressed genes between these three types of MSCs was shown on the Venn diagram. GO-BP (d) and KEGG analyses (e) were utilized to evaluate the functions of these three types of MSCs based on their differentially expressed genes

