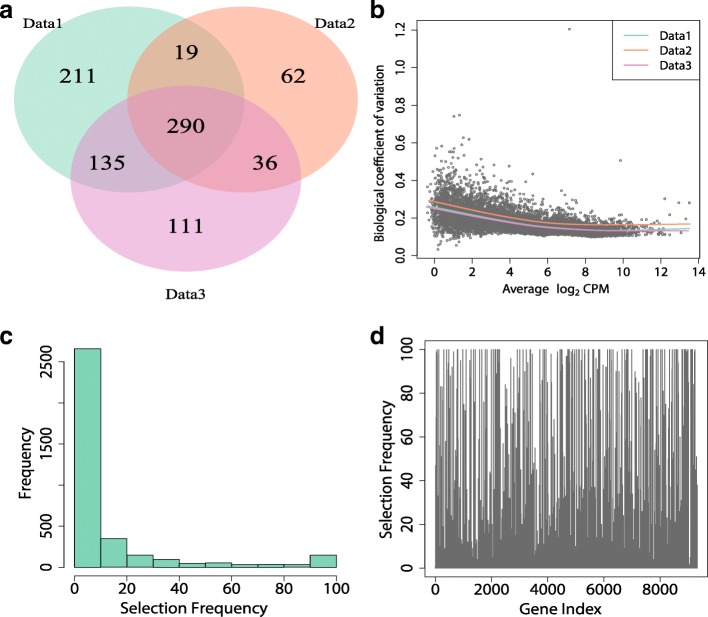
Fig. 1.
Selection frequency of the Bottomly dataset [23] by edgeR-robust. Bottomly dataset contains ten and eleven replicates of two different, genetically homogeneous mice strains. Sub-datasets are generated by randomly selected five biological replicates for each condition. a Venn diagram of 3 randomly selected sub-datasets. b Scatterplot of biological coefficient of variation (BCV) against average of log2 of counts per million (CPM) of the first randomly selected sub-dataset. Three fitted BCV-CPM trends are represented by different colors. c Histogram of selection frequency for 3596 genes that were selected at least once over 100 randomly selected sub-datasets. d Selection frequency for each feature over 100 randomly selected sub-datasets

