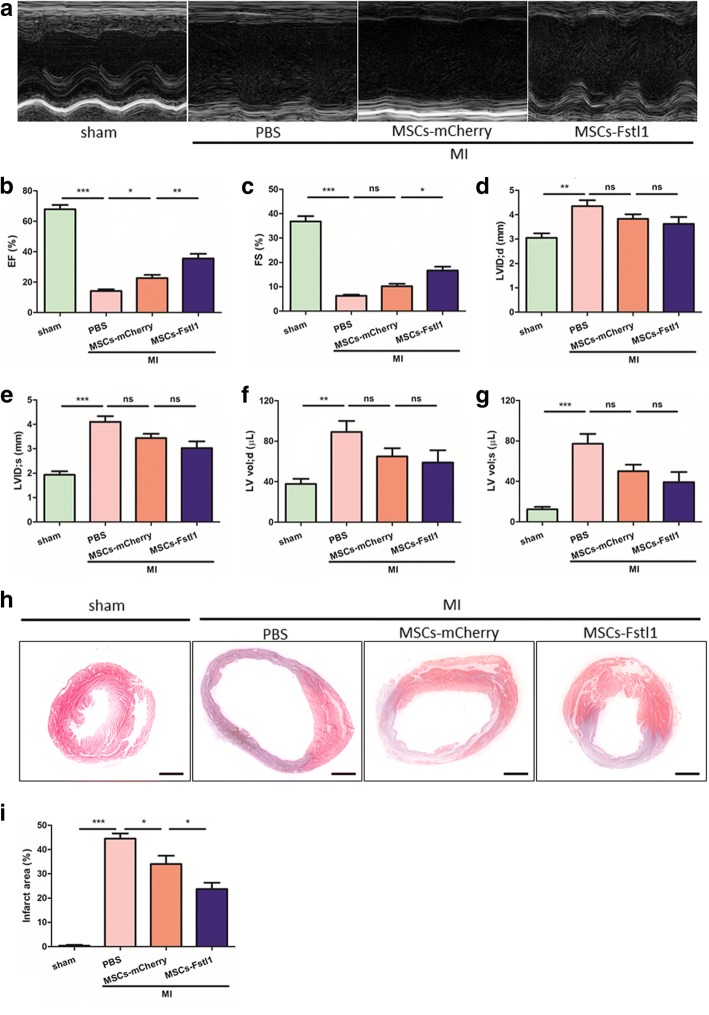
Fig. 5.
Enhanced post-MI cardiac function and limited scar formation after MSCs-Fstl1 transplantation. a Representative echocardiographic images on post-therapy 7 days. EF (b), FS (c), LVID;d (d), LVID;s (e), LV vol;d (f), and LV vol;s (g) were analyzed, respectively (n = 7–10). Macroscopic view (h) and statistical analysis (i) of Masson’s trichrome staining on post-therapy 7 days. Scale bar = 1 mm. (n = 5). *P < 0.05; **P < 0.01; ***P < 0.001. EF, ejection fraction; FS, fractional shortening; ns, not significant

