Fig. 8.
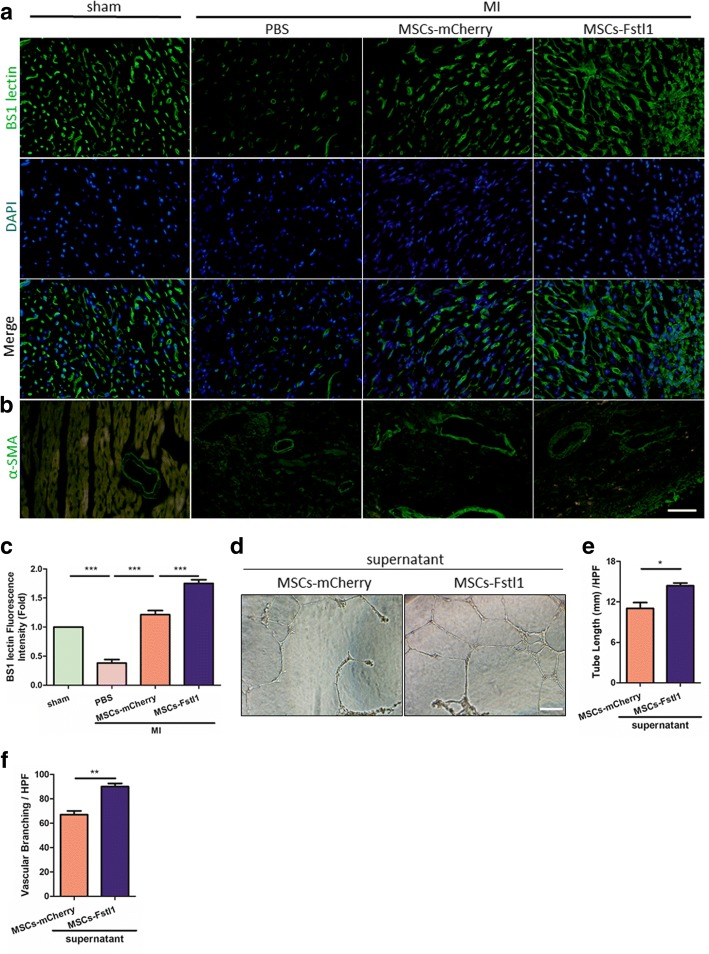
Enhanced neovascularization in MSCs-Fstl1-treated peri-infarct zones. Representative images of BS1 lectin (a) and α-SMA (b) staining within the infarct border zone on post-therapy 7 days. Scale bar = 50 μm. c Vascular density determined by BS1 lectin signal (n = 4). d–f HUVECs were incubated with a mixture of EGM-2 and MSCs conditioned medium as illustrated (1:1) for 12 h on Matrigel. d Representative images of the capillary network are shown. Scale bar = 100 μm. Quantification of tube length (e) and vascular branching (f) per high-power fields (HPF) were performed (n = 3). *P < 0.05; **P < 0.01; ***P < 0.001. α-SMA, α-smooth muscle actin; HPF, high-power fields

