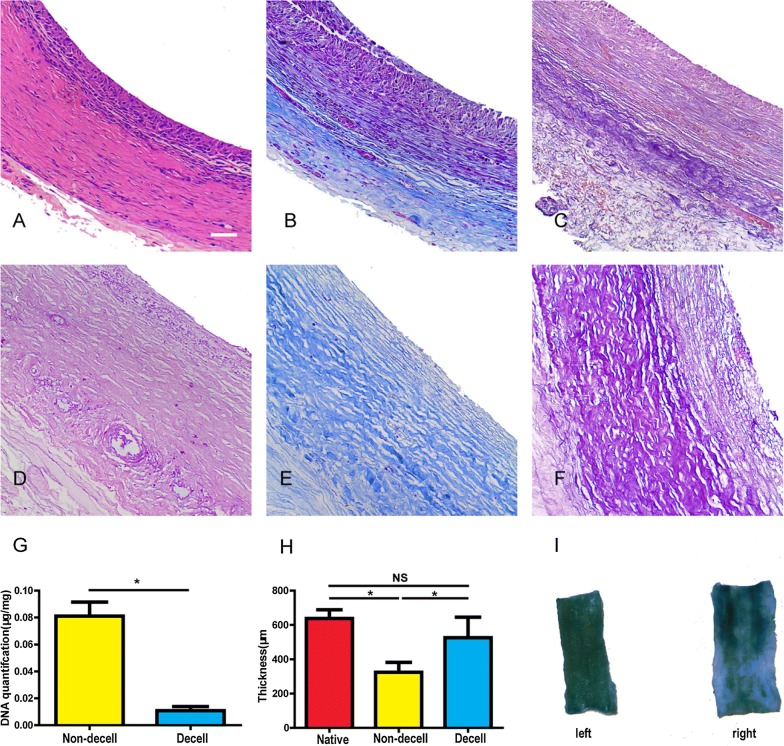
Fig. 2.
Autologous tissue conduits before (A–C) and after (D–E) decellularization. H&E staining (A, D), Masson’s trichrome staining (B, E), Verhoeff’s staining (C, F). G The average wall thickness of the common carotid artery, non-decellularized and decellularized autologous tissue conduits. H DNA quantification of non-decellularized and decellularized autologous tissue conduits. I Qualitative (left) and stabilization (right) test of heparin by toluidine blue for the inner surface of the tissue conduit. Scale bar, 50 μm

