
Figure 3.
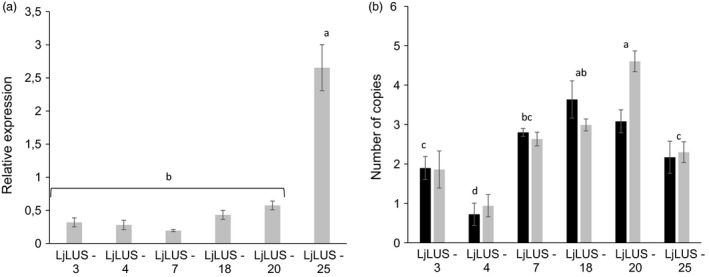
Expression and copy number of lupeol‐producing strains. (a) qPCR analysis of six lines showing expression of the Lotus japonicus lupeol synthase (LjLUS) mRNA relative to the geometric average of the RP3a and UBQ reference genes (b) Copy number of integrated LjLUS expression cassettes (black) and the ble r resistance marker (grey). Error bars represent the standard deviation from three biological replicates. Identical letters denote groups where means are not statistically different according to a post hoc Tukey test with α = 0.01.