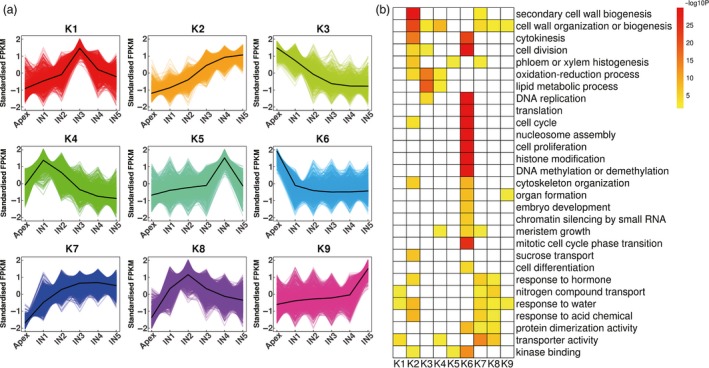
Figure 5.

K‐means clustering and enrichment analysis of transcripts differentially expressed between the apex and IN1‐5. (a) K‐means clustering showing the transcriptome expression profiles. Nine clusters were identified based on expression levels in six developmental zones (Apex, IN1, IN2, IN3, IN4 and IN5). (b) Gene Ontology enrichment among the nine clusters. Yellow to red, significant enrichment; white, not significant.
