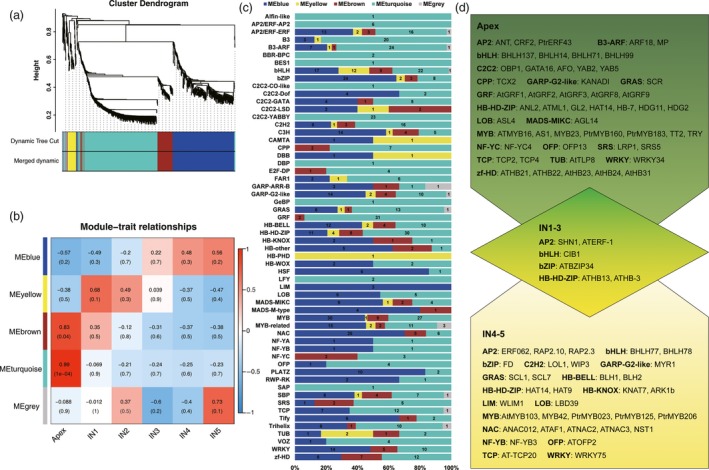
Figure 6.

Weighted Gene Co‐expression Network Analysis (WGCNA) of transcription factors. (a) Cluster dendrogram of transcription factors based on expression levels in the six developmental zones (Apex, IN1, IN2, IN3, IN4 and IN5). Each branch represents a gene and each colour below represents a gene co‐expression module. Dynamic tree cut indicates the modules divided based on the gene clustering results. Merged dynamic indicates the modules divided by combining modules with similar expression patterns. (b) Heatmap of transcription factor expression patterns in different samples (Apex, IN1, IN2, IN3, IN4 and IN5). The expression patterns of five modules are shown by the heatmap. The colour bar indicates expression levels from low (blue) to high (red). (c) Distribution of transcription factor families in different WGCNA modules. Each colour represents a co‐expression module, and the numbers indicate the number of transcription factors in the module. (d) Transcription factors highly expressed in the apex, IN1‐3 and IN4‐5.
