Figure 2.

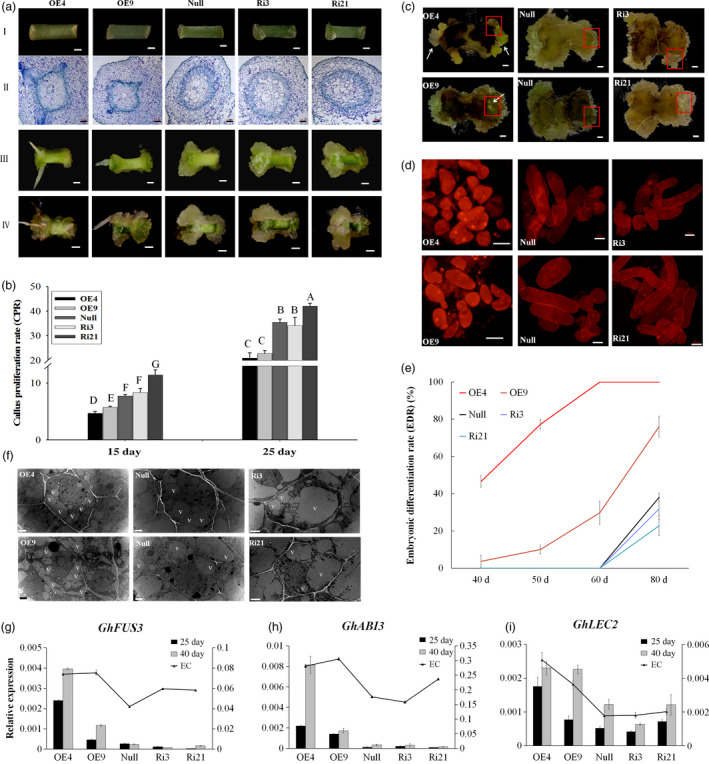
GhL1L1 positively regulates cell fate specification during cotton SE. (a) The phenotypes of different GhL1L1 transgenic and null lines at 7 (I, scale bars = 1 mm; II, scale bars = 200 μm), 15 (III, scale bars = 5 mm) and 25 days postinduction (IV, scale bars = 5 mm). (b) The callus proliferation rate (CPR) of different transgenic and null lines at 15 and 25 days post‐induction. Different capital letters denote significant differences by multiple comparisons using Statistix 8.0 software. (c) The ECs or embryos were observed for the overexpression line (OE4 and OE9) explants (white arrows) at 40 days postinduction, scale bars = 2.5 mm. (d) Cellular features of the calluses from red boxes of (c), scale bars = 50 μm. (e) The embryonic differentiation rate (EDR) of different transgenic lines and null at 40, 50, 60 and 80 days post‐induction. (f) The ECs of different transgenic lines and null scanned by transmission electron microscopy. v, vacuole. Scale bars = 2 μm. qRT–PCR analysis shows GhFUS3 (g), GhABI3 (h) and GhLEC2 (i) in GhL1L1 transgenic and null lines at 25 and 40 days post‐induction and ECs (embryogenic calluses from the corresponding transgenic lines and null). The data (in b, e, g, h and i) are shown as the mean ± SE (n = 3).
