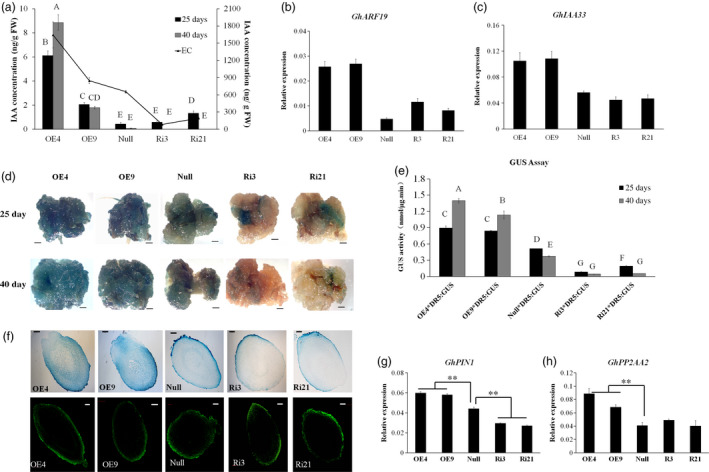
Figure 3.

Auxin accumulation and distribution in GhL1L1 transgenic and null lines during SE. (a) The IAA concentration in different transgenic and null lines at 25 and 40 days postinduction and ECs (embryogenic calluses from the corresponding transgenic and null lines). Expression analysis of the auxin response genes GhARF19 (b) and GhIAA33 (c) by qRT‐PCR. GUS expression (d) and GUS activity (e) of explants from five F1 hybrids ( OE4/DR5::GUS, OE9/DR5::GUS, Ri3/DR5::GUS, Ri21/DR5::GUS, null/DR5::GUS ) at 25 and 40 days postinduction, scale bars = 2.5 mm. Different capital letters denote significant differences by multiple comparisons using Statistix 8.0 software. (f) GUS staining (upper) and IAA immunofluorescence (below) of longitudinal section of torpedo embryos from GhL1L1 transgenic and null lines, scale bars = 100 μm. Expression analysis of GhPIN1 (g) and GhPP2AA2 (h) in ECs of different transgenic and null lines. The data (in a, b, c, e, g and h) are shown as the mean + SE (n = 3). Statistical analyses were performed using Student's t‐test. **p < 0.01.
