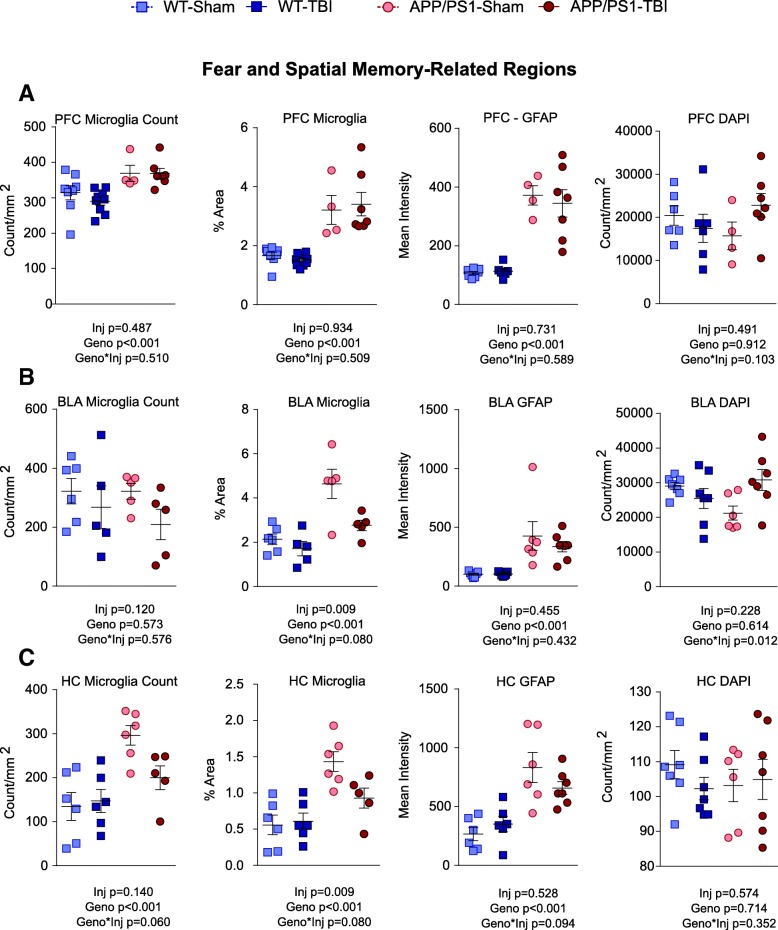
Fig. 6.
Quantification of grey matter pathology at fear and spatial memory-related regions. On the basis of images in Fig. 5, the total density of microglia, the stained area of all microglia, the mean intensity of GFAP fluorescence, and the count of total nucleus were plotted for (a) prefrontal cortex, (b) amygdala, and (c) hippocampus. Data are plotted as mean ± SE with an overlaid scatterplot of individual animals

