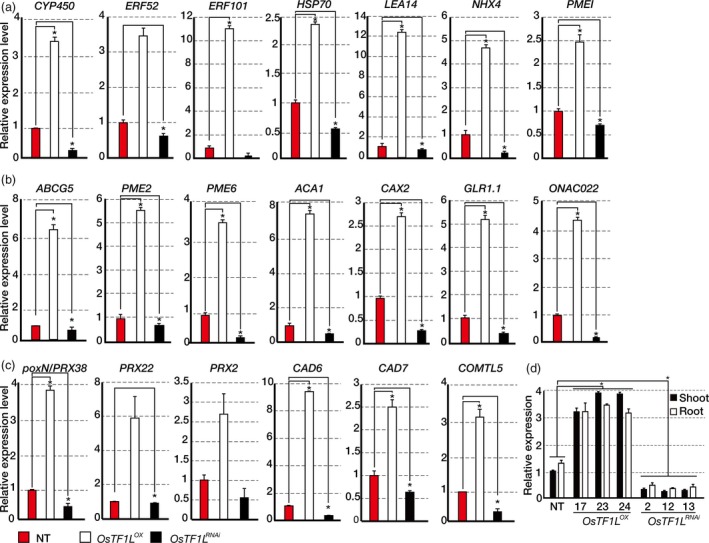
Figure 2.

qRT‐PCR analysis showing the transcript levels of drought‐inducible genes (a), stomatal movement related genes (b) and lignin biosynthetic genes (c) in 1‐month‐old OsTF1 LOX and OsTF1 LRNA i shoots. Ubi1 was used as the reference gene. Data are shown as the mean ± SD of three biological and two technical replicates. (d) qRT‐PCR analysis of OsTF1L expression in 5‐week‐old OsTF1 LOX (#17, 23, 24), OsTF1 LRNA i (#2, 12, 13) and NT plants. Ubi was used as an internal control. Data bars represent the mean ± SD of two biological replicates, each of which had three technical replicates. Asterisks indicate significant differences compared with NT (P < 0.05, one‐way ANOVA).
