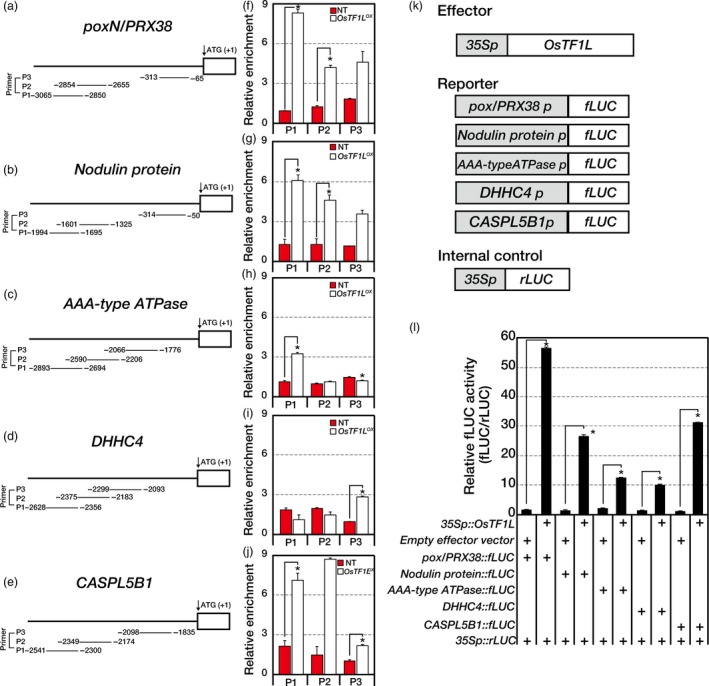
Figure 3.

ChIP‐qPCR and transient protoplast assays for OsTF1L interacting with promoters of the selected genes in ChIP‐seq and RNA‐seq analysis. (a–j) Two‐week‐old OsTF1 LOX and NT shoots were used in the ChIP‐qPCR experiments with an anti‐myc antibody. (a–e) Promoter regions showing three PCR‐amplified regions (P1–P3). (f–j) ChIP‐qPCR data show each PCR amplification region of each gene. The relative enrichment was normalized with total input. Data are shown as the mean ± SD of three independent experiments. (k, l) Transient protoplast expression assay using a dual‐luciferase reporter system. (k) Schematic diagram of the effector, internal control and five reporter constructs. (l) Relative fLUC (fLUC/rLUC) activity in rice protoplasts. Data are shown as the mean ± SD of three independent experiments. Asterisks indicate significant differences compared with NT (P < 0.05, Student's t‐test).
