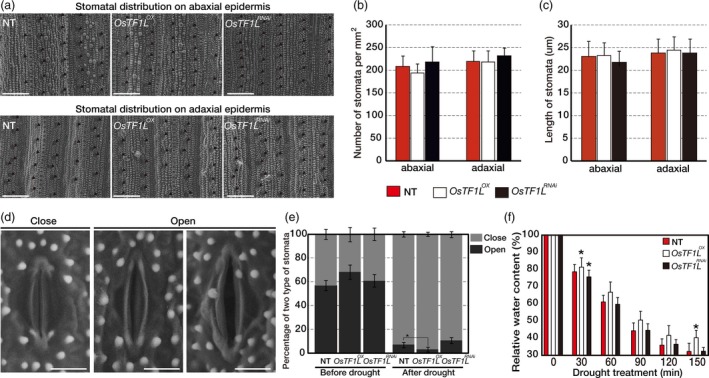
Figure 5.

Overexpression of OsTF1L Increasing Stomatal Closure. (a) Scanning electron microscopy images (600×) of the abaxial and adaxial leaf epidermis, where stomata are marked by black arrowheads. Scale bar represents 100 μm. (b) Average stomata numbers per square millimetre calculated from 10 plants for each line. Values are mean ± SD. (c) Comparison of the stomata length between NT and transgenic plants. Twenty stomata were measured for each plant. Ten plants were used for each line. Values are mean ± SD. (d) Scanning electron microscopy images (2000×) of two levels of stomata opening. Scale bar represents 10 μm. (e) The percentage of two levels of stomatal apertures in the leaves of OsTF1 LOX, OsTF1 LRNA i and NT plants under normal and drought stress conditions. Twenty stomata were measured for each plant. Ten plants were used for each line. Values are mean ± SD. Asterisks indicate significant differences compared with NT (P < 0.05, one‐way ANOVA). (f) Relative water content of detached leaves. For each replicate, fully expanded ten leaves of 3‐month‐old mature plants were used for each line. Data are shown as the mean ± SD of three independent lines and two experimental replicates. Asterisks indicate significant differences compared with NT (P < 0.05, one‐way ANOVA).
