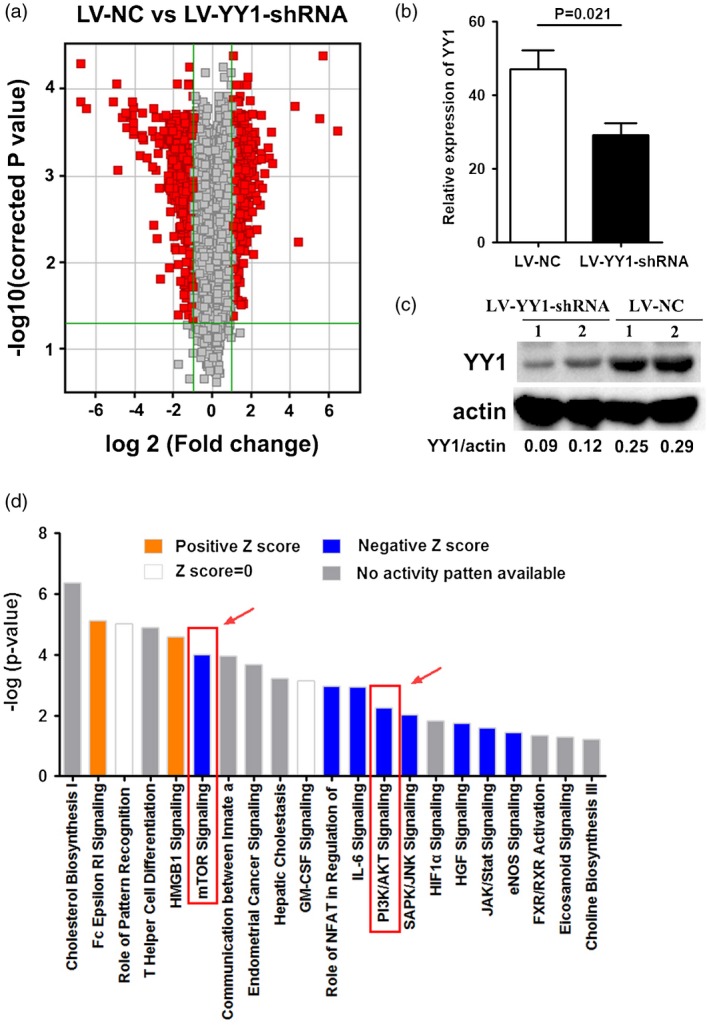
Figure 2.

Mammalian target of rapamycin (mTOR) signaling was restrained by Yin Yang 1 (YY1) blockade. (a) Volcano plot analysis of differences in gene distribution between lentivirus‐control (LV‐NC) or LV‐YY1‐short hairpin (shRNA)‐treated peripheral blood mononuclear cells (PBMC). The x‐axis is the logarithmic transformation with 2 as base of the fold change. The y‐axis is the logarithmic transformation with 10 as base of the statistical significance. (b) mRNA expression of YY1 in LV‐NC‐ or LV‐YY1‐shRNA‐treated PBMC detected by real‐time polymerase chain reaction (PCR). (c) Protein level of YY1 in LV‐NC‐ or LV‐YY1‐shRNA‐treated PBMC detected by Western blot. (d) The histogram of the signaling pathway shows the enrichment of the differentially expressed genes in the classical signaling pathway, and the analysis was shown by Z‐score. Positive Z‐score (yellow) indicated that the pathway was significantly activated. Negative Z‐score (blue) indicated that the pathway was significantly suppressed.
