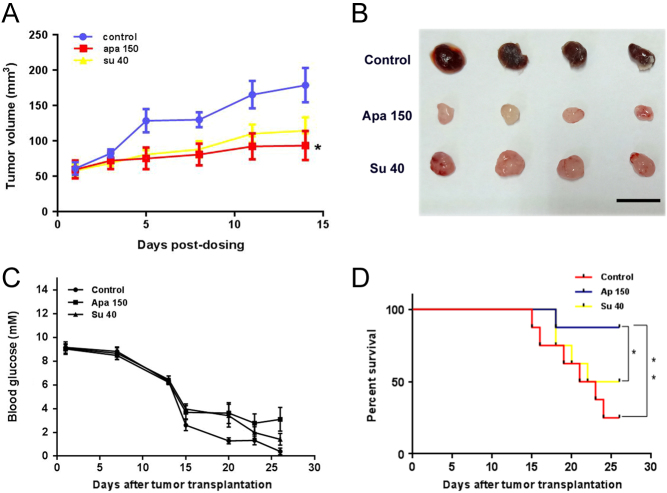
Figure 4.
Antitumor activity of apatinib against INS-1 subcutaneous tumors in nude mice. (A and B) Tumor growth in apatinib- or sunitinib-treated mice (n = 8). Experiment was terminated when four mice died in the control group. (A) Tumor volumes measured every other day. (B) Representative picture of tumors in three groups. Scale bar, 1 cm. Apa 150, apatinib 150 mg/kg; Su 40, sunitinib 40 mg/kg. (C and D) Blood glucose and survival rate in apatinib- or sunitinib-treated mice (n = 8). Blood glucose was measured at indicated time points (C) and the survival rate (D) was recorded in the same batch of experiment.

 This work is licensed under a