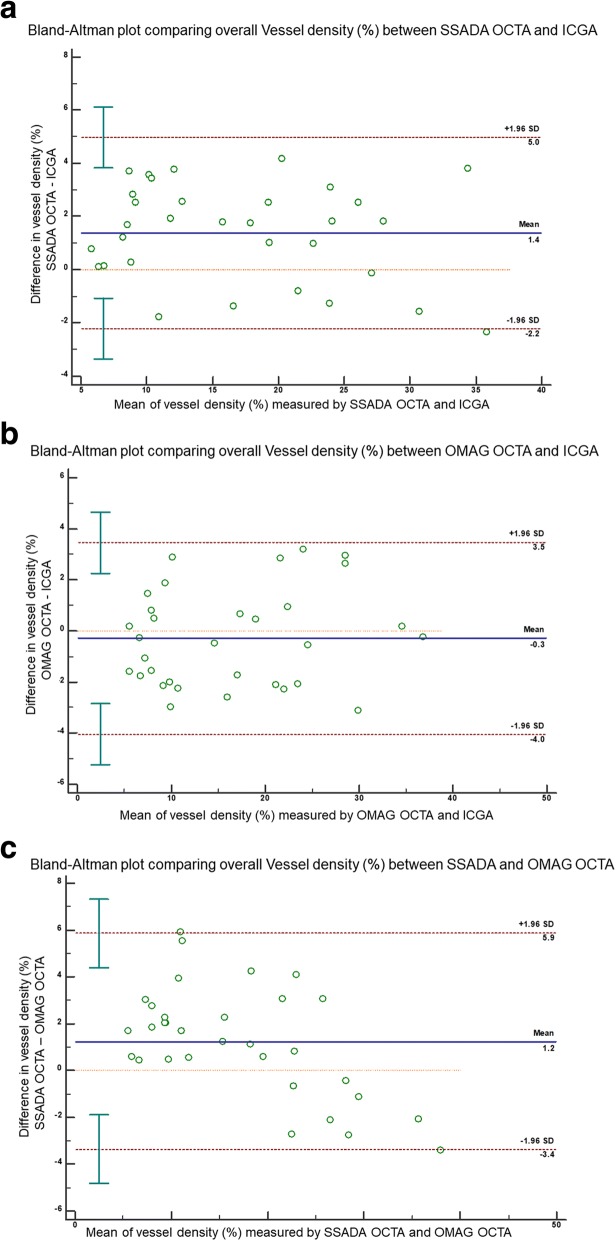
Fig. 4.
Bland-Altman plots comparing vessels density measurements from OCTA with ICGA. The Bland-Altman plot between the differences (y-axis) of vessels density measurements from (a) SSADA OCTA and ICGA, (b) OMAG OCTA and ICGA and (c) SSADA OCTA and OMAG OCTA as the deviation from the mean vessels density values comparing the corresponding two methods (x-axis) — showing good agreement of vessels density between all imaging methods. Solid line = mean of the difference. Short dashed line = reference zero. Long dashed line = upper and lower 95% limits of agreement (mean + 1.96 SD, mean − 1.96 SD). SD = standard deviation of the mean difference

