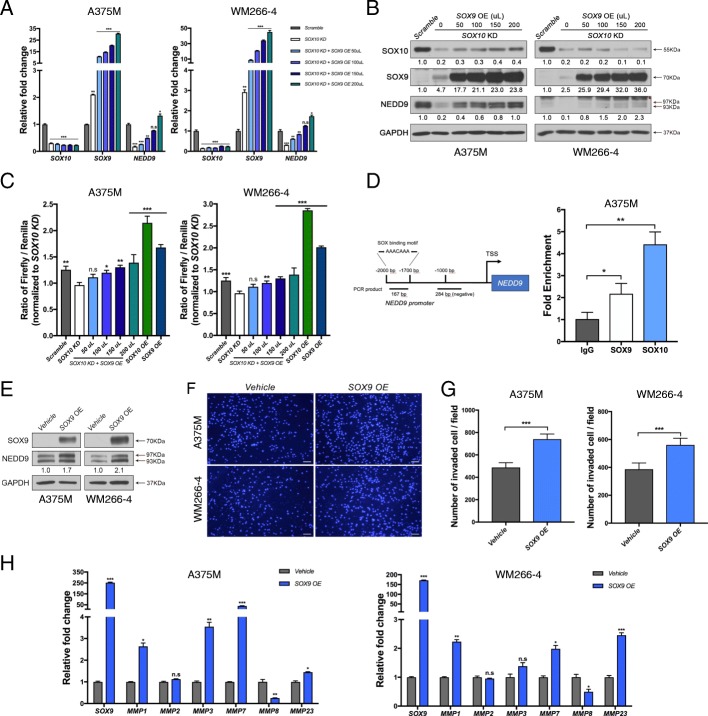
Fig. 5.
Overexpression of SOX9 transactivates NEDD9 and induces MMPs expression. a qPCR analysis for the expression levels of SOX10, SOX9, and NEDD9 in A375M and WM266–4 cell lines treated with scramble control, SOX10 KD alone and SOX10 KD together with increasing amount of SOX9 OE lentiviruses. b Immunoblotting for the indicated antibodies on protein lysates derived from A375M and WM266–4 cells treated with the indicated constructs. The intensity of protein bands in arbitrary units for SOX10, SOX9, and NEDD9 in each melanoma cell line is relative to scramble control which is set to 1 as a reference. The red arrow indicates the phosphorylated form of NEDD9. Asterisk indicates non-specific bands. GAPDH serves as a loading control. c A375M and WM266–4 cells were transfected with a 1 kb-NEDD9 promoter-driven luciferase reporter construct plus renilla for normalization of transfection efficiency together with scramble control, SOX10 KD, SOX10 KD plus increasing amount of SOX9 OE lentiviruses, SOX10 OE, and SOX9 OE. Fold activation of three independent luciferase assays. SOX10 KD is set to 1 as a reference. d Schematic diagram showing the presence of a SOX binding motif within the 167 bp DNA fragment detected by ChIP-qPCR whereas the 284 bp fragment serves as a negative control. ChIP-qPCR data showing a higher DNA binding capacity by SOX10 than SOX9. Anti-IgG serves as a negative control. e Western blot analysis using the indicated antibodies on protein lysates derived from A375M and WM266–4 cells treated with vehicle control and SOX9 OE. The red arrow indicates the phosphorylated form of NEDD9. f DAPI images of transwell invasion of melanoma cells treated with the indicated constructs. g Transwell invasion assay for each cell line treated with the vehicle alone and SOX9 OE lentivirus. Scale bars: 100 μM. h mRNA expression of SOX9 and members of MMP family were quantified by qRT-PCR in A375M and WM266–4 cells treated with the vehicle alone and SOX9 OE. Error bars represent mean ± SD of three independent experiments. n.s, non-significant; *p < 0.05, **p < 0.01, ***p < 0.001

