Figure 1.
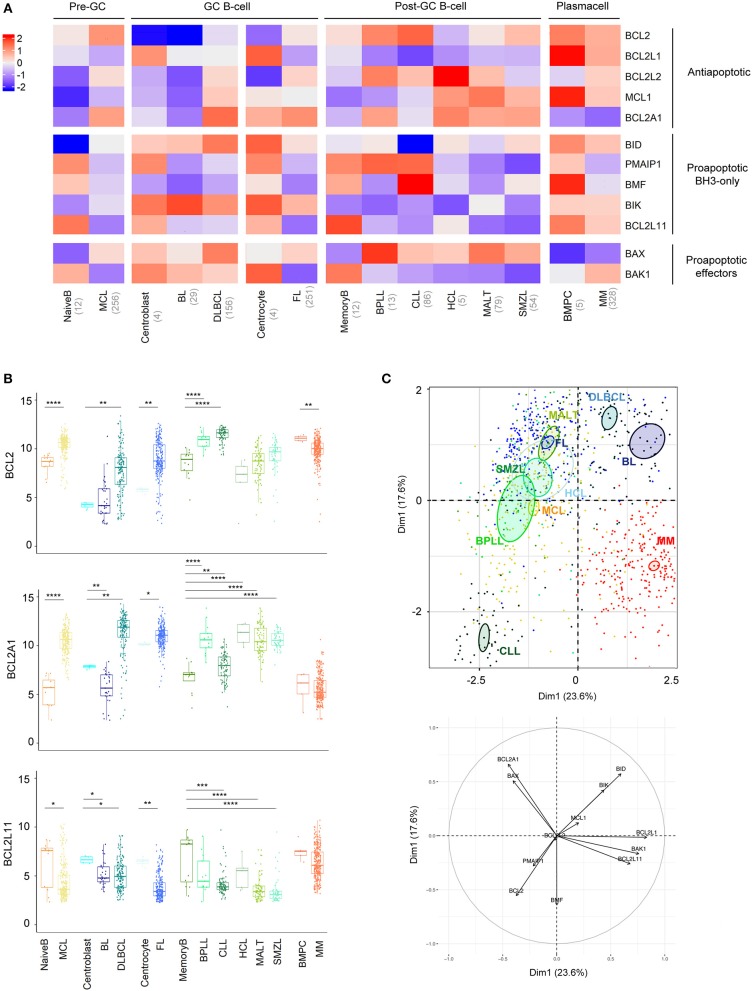
BCL2-family is strongly deregulated in the landscape of B-cell malignancies. (A) Heat-map of Bcl-2 gene expression profiles among B-cell malignancies. The color corresponds to the intensity of the median gene expression. Blue indicates lower and red higher transcript abundance. MCL, Mantle Cell Lymphoma; BL, Burkitt lymphoma; DLBCL, Diffuse Large B-cell Lymphoma; FL, Follicular Lymphoma; BPLL, B-cell Prolymphocytic Leukemia; CLL, Chronic lymphocytic leukemia; HCL, Hairy Cell Lymphoma; MALT, mucosa-associated lymphoid tissue lymphoma; SMZL, Splenic Marginal Zone Lymphoma; BMPC, Bone Marrow Plasma Cell, MM: multiple Myeloma. (B) Expression of BCL2, BCL2A1, and BCL2L11 in the different B-cell malignancies compared to their respective control. Wilcoxon-Mann-Whitney tests. *p < 0.05, **p < 0.01, ***p < 0.001, ****p < 0.0001. (C) Representation of the individual factor map of each sample for the PCA and according to the two first dimensions. Colored ellipses are drawn around the mean of the group (= barycenter), with the 95% confidence interval of the mean in the corresponding plan. BCL2 is coding for Bcl-2 protein, BCL2L1 for Bcl-xL, MCL1 for Mcl-1, BCL2L2 for Bcl-w, BCL2A1 for Bfl1, BIK for Bik, PMAIP1 for Noxa, BMF for Bmf, BID for Bid, BCL2L11 for Bim, BAX for Bax, and BAK1 for Bak.

