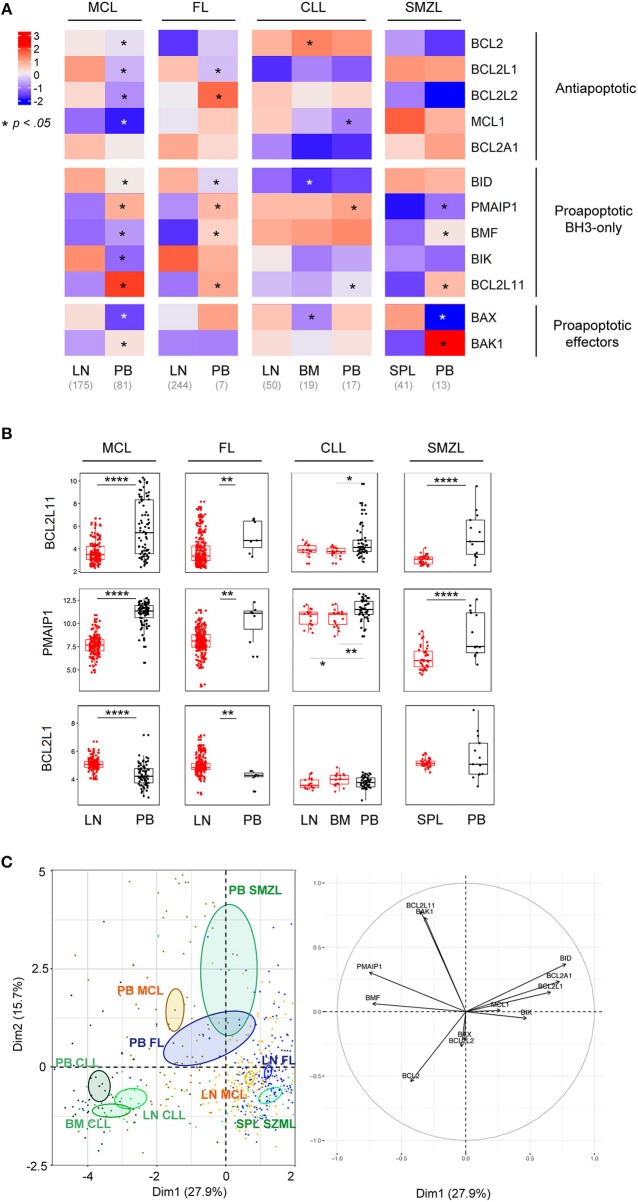
Figure 2.
BCL2-family is regulated by the tumor microenvironment. (A) Heat-map of Bcl-2 gene expression profiles for MCL, FL, CLL, and SMZL in function of their tissue localization. Wilcoxon-Mann-Whitney tests. *p < 0.05. (B) Comparison of BCL2L11, PMAIP1, and BCL2L1 gene expression according to their localization. LN, lymph nodes; PB, peripheral blood; BM, bone marrow. Wilcoxon-Mann-Whitney tests. **p < 0.01, ****p < 0.0001. (C) Representation of the individual factor map for the PCA according to the two first dimensions and their respective correlation circle. Colored ellipses are drawn around the mean of the group (= barycenter), with the 95% confidence interval of the mean in the corresponding plan.

