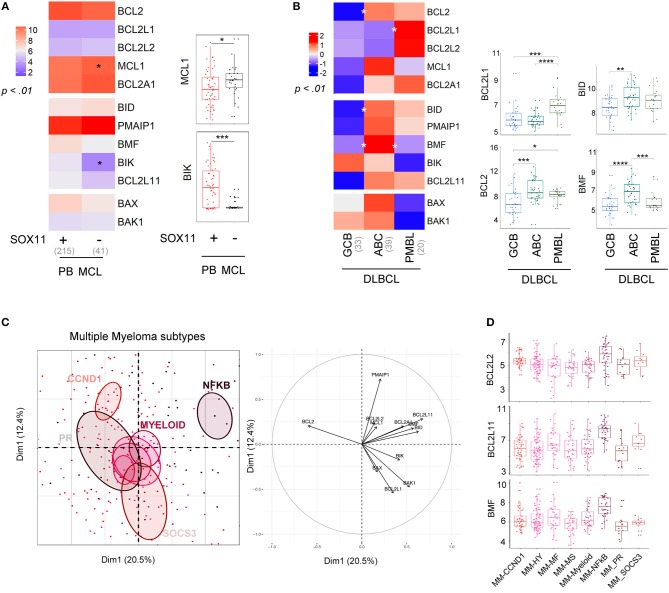
Figure 3.
Molecular subtypes display differential expression of the BCL2-family. (A) left; Heat-map of BCL2-family expression profile comparing PB MCL according to SOX11 gene expression (right). MCL1 and BIK expression in the two molecular subgroups. (B) left; Heat-map of BCL2-family expression profile comparing the different subtypes of DLBCL: GCB (germinal center B cell, ABC (activated B-cell) and PMBL (Primary mediastinal B-cell lymphoma). right; Gene expression of BCL2L1, BCL2, BID, and BMF for the three subtypes of DLBCL. (C) Representation of the individual factor map for the PCA and according to the two first dimensions of multiple myeloma samples and their respective correlation circle. Colored ellipses are drawn around the mean of the group (= barycenter), with the 95% confidence interval of the mean in the corresponding plan. (D) BCL2L2, BCL2L11, and BMF expression in the different multiple myeloma subtypes. *p < 0.05, **p < 0.01, ***p < 0.001, ****p < 0.0001.

