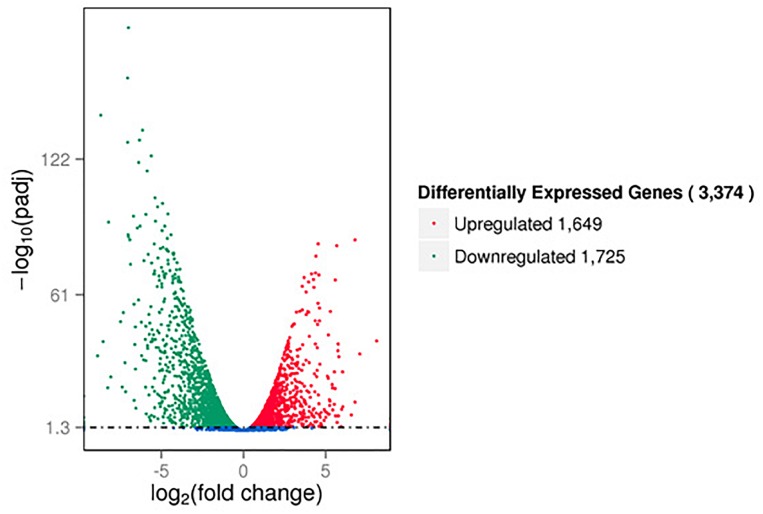
FIGURE 1.
Volcano plots of differentially expressed genes based on RNA sequencing analysis of untreated and DADS-treated Pseudomonas aeruginosa PAO1. Each gene is represented by a dot in the graph. The x-axis and y-axis represent the log2 value of the fold change and the t-statistic as –log10 of the p-value, respectively. The genes represented in red (upregulated) and green (downregulated) are differentially expressed genes with >twofold change and a p-value < 0.05.

