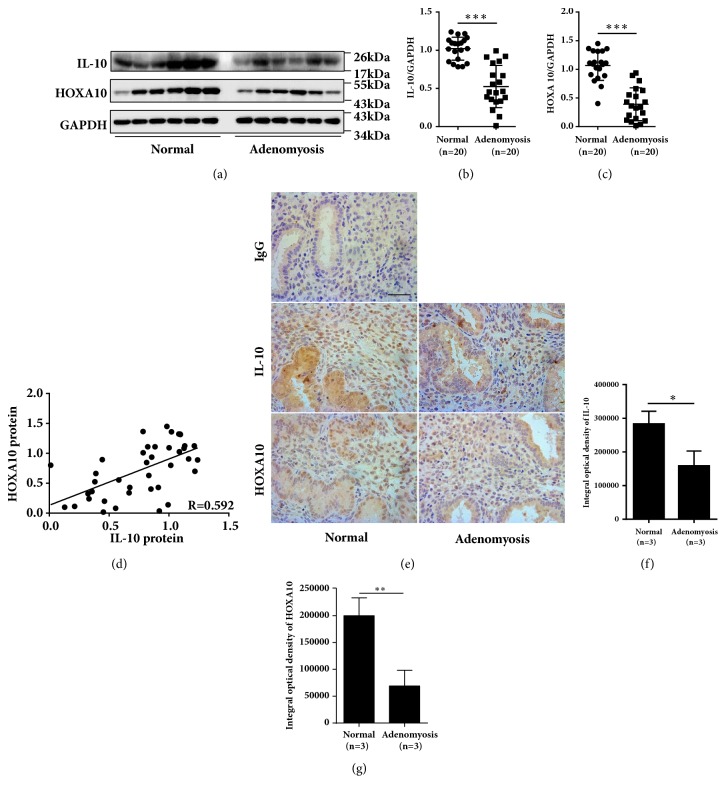
Figure 1.
Reduced expression of HOXA10 and IL-10 in women with adenomyosis. Timed midsecretory endometrial biopsies from normal control women (n=20) and women with adenomyosis (n=20) were analyzed for IL-10 and HOXA10 expression via western blotting (a), and the expression levels of IL-10 (b) and HOXA10 (c) were compared between the two groups. The correlation between IL-10 and HOXA10 protein levels was analyzed in all of the women (n=40) (d). Representative images of IL-10 and HOXA10 staining in endometria from women with adenomyosis and normal controls are presented (e). The integrated optical densities (IODs) of total IL-10 (f) and total HOXA10 (g) were compared between the two groups (n=3).The data are plotted as the mean ± SEM. ∗P<0.05; ∗∗P<0.01; ∗∗∗P<0.001.

