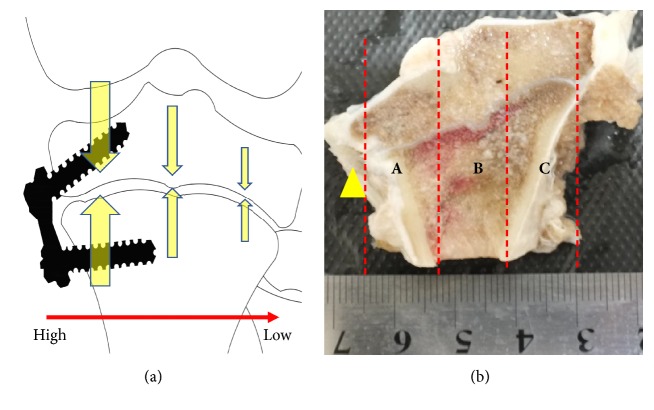
Figure 2.
Sample of proximal tibia ((a) sketch map showed that the stress acting on the cartilage in the hemiepiphysiodesis process was an asymmetric distribution; (b) the yellow arrow points to the surgical site. The proximal tibia specimen was divided into 3 parts from the inside to the outside: A, B, and C).

