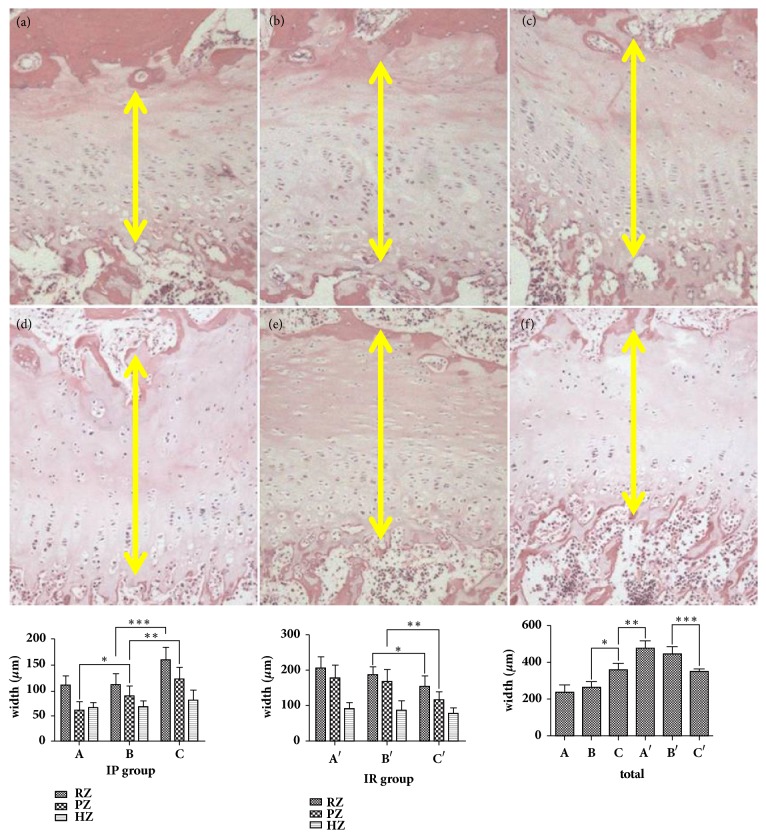
Figure 3.
The thickness of growth plate in different area (representative H&E staining showing growth plate thickness (a) A area in the IP group; (b) B area in the IP group; (c) C area in the IP group; (d) A area in the IR group; (e) B area in the IR group; (f) C area in the IR group; yellow double arrow: the thickness of the growth plate; IP group: ∗=0.0089; ∗∗=0.008; ∗∗∗= 0.0011; IR group: ∗=0.0023; ∗∗=0.0019; total width of growth plate: ∗≤0.001; ∗∗≤0.001; ∗∗∗≤0.001; RZ: resting zone, PZ: proliferative zone, HZ: hypertrophic zone, 100 X magnification).

