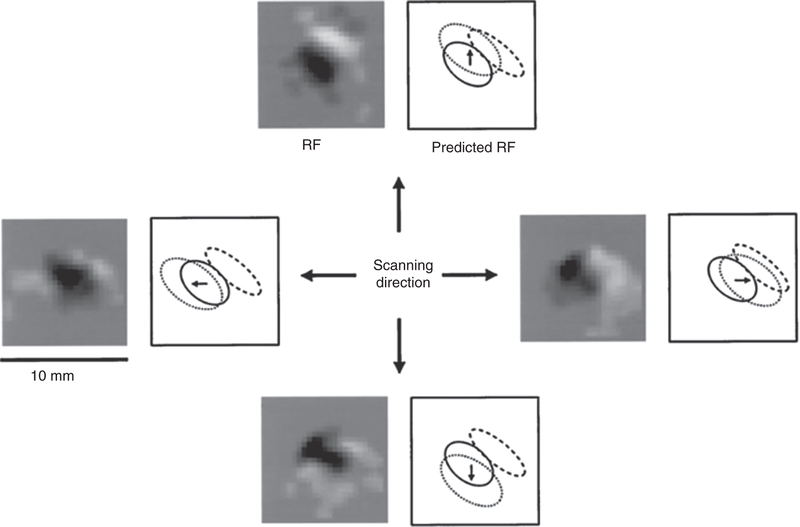
Figure 7.
Spatial structure of receptive fields of a neuron in area 3b. The two squares in each group display the RF estimated from the raw data (left) and the positions of the modeled Gaussian representations (right). Left: The experimental RF was obtained by continuously scanning the finger with a random pattern of raised dots, and then computing an RF map using reverse correlation (see (82)). Dark regions are excitatory, white regions are inhibitory. Right: The locations of the excitatory (solid ellipse) and fixed inhibitory components are unaffected by scanning direction and the lagged inhibitory component (dotted ellipse) trails the center by a fixed distance in each direction. Reproduced, with permission, from (81).

