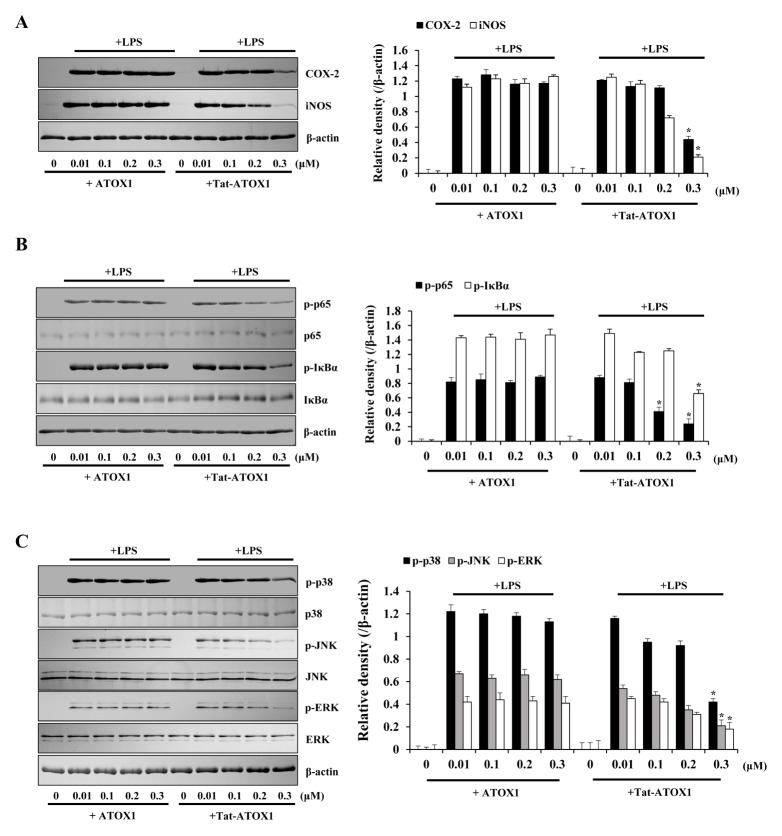
Fig. 2.
Effects of Tat-ATOX1 on LPS-induced inflammatory responses in Raw 264.7 cells. The cells were pretreated with Tat-ATOX1 (0.3 μM) for 1 h, then treated with LPS (1 μg/ml). Expression levels of COX-2 and iNOS protein (A), NF-κB (B) and MAPK (C) activation were determined by Western blotting. The band intensity was measured by densitometry. *P < 0.01, compared to LPS-treated cells.

