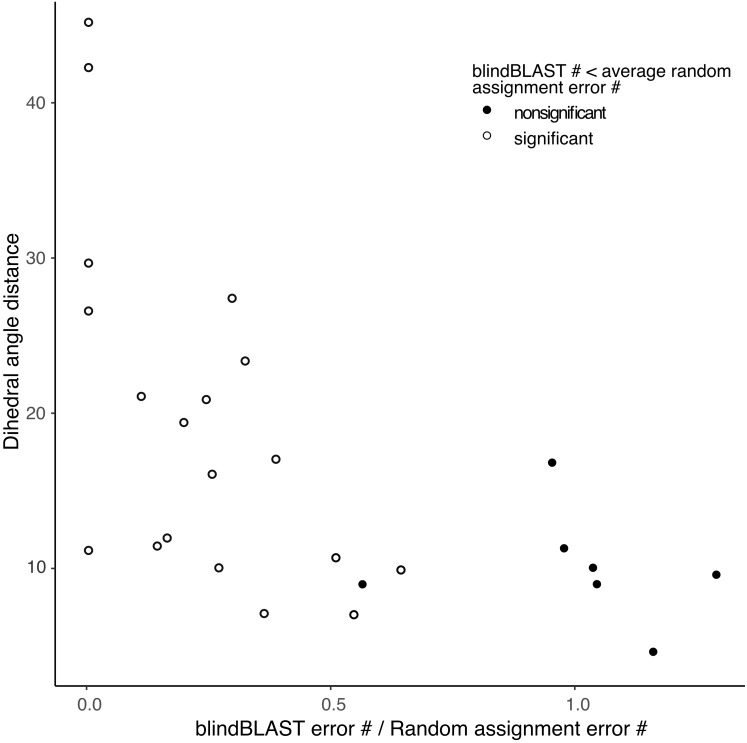
Figure 3. Small distance between a pair of clusters is associated with higher likelihood of misclassification using blindBLAST.
Each point corresponds to a misclassification from cluster X → cluster Y, with a minimum of three misclassifications required. The x axis is the ratio of the average error count for blindBLAST to the average error count for random assignment. The y axis is the dihedral angle distance between the two clusters’ exemplars. BlindBLAST misclassifications are significantly fewer than random when dihedral angle distance between exemplars is large.

