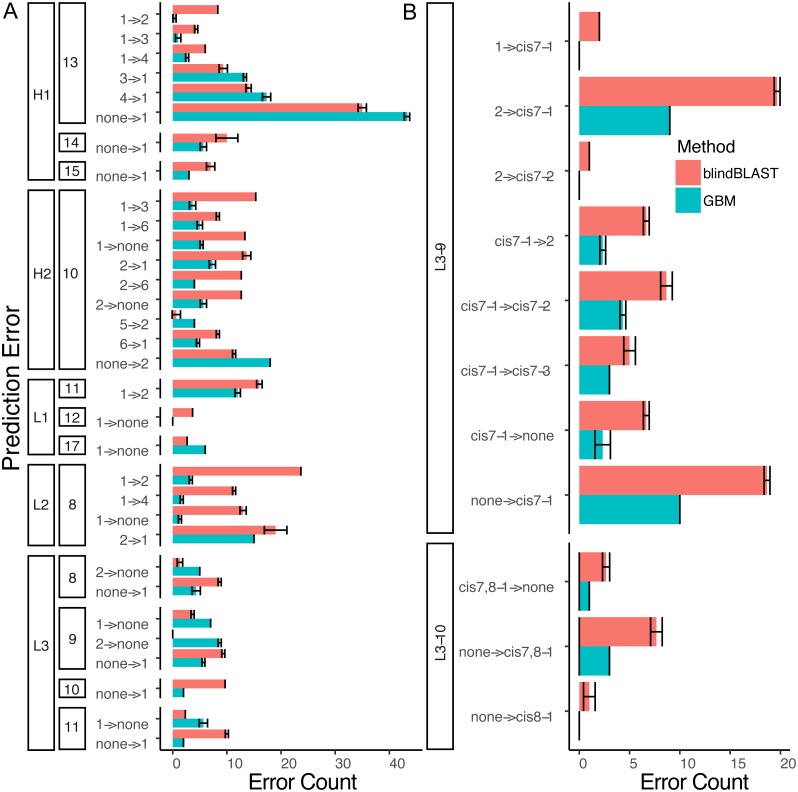
Figure 7. A detailed dissection of error count reduction by the GBM model.
(A) All misclassifications with a difference of three or more in error count between GBM and blindBLAST are plotted. A misclassification labeled as 1 →2 denotes queries belonging to cluster 1 that are incorrectly classified as cluster 2. (B) Misclassifications involving at least one cis cluster with corresponding blindBLAST and GBM error counts.

