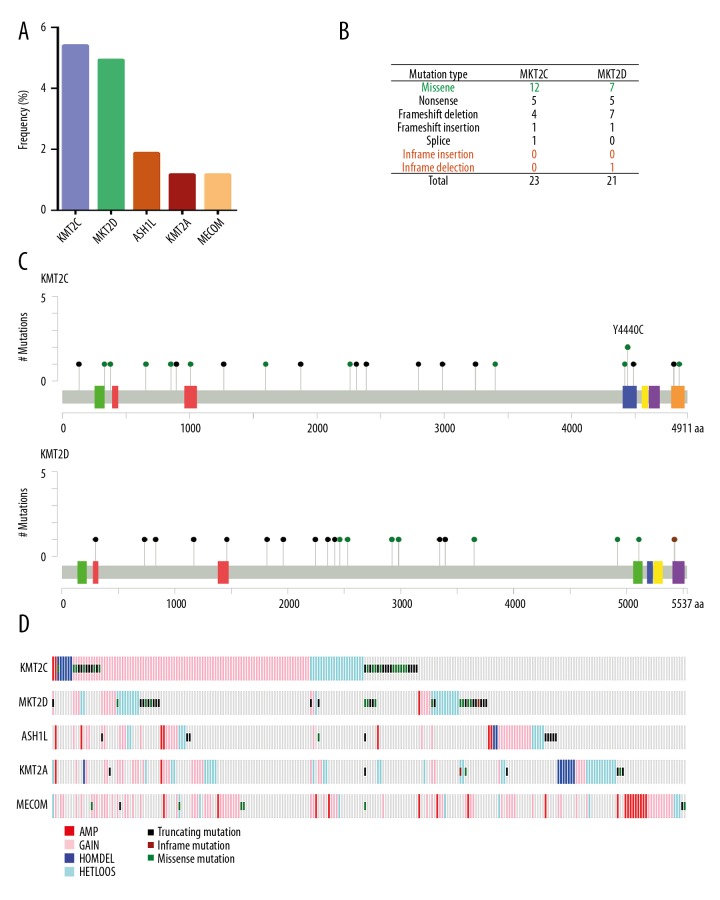
Figure 4.
The KMT2C and KMT2D gene mutation spectrum in prostate carcinoma. (A) Bar graphs show the top five mutated histone methyltransferases (HMTs). (B) The frequency of each mutation type for KMT2C and KMT2D from 429 primary prostate adenocarcinomas. The data were obtained from The Cancer Genome Atlas (TCGA) database. (C) The images show protein domains and the positions of specific mutations of the KMT2C and KMT2D genes. A green dot indicates a missense mutation. The black dot indicates a truncating mutation include nonsense mutation, frameshift deletion, insertion, or splice. A brown dot indicates an in-frame insertion or deletion mutation. (D) Mutual exclusivity relationship for copy number alterations and mutation of the top five mutated HMTs in prostate cancers.

