
Extended Data Figure 6. The role of glycolytic genes for efferocytosis.
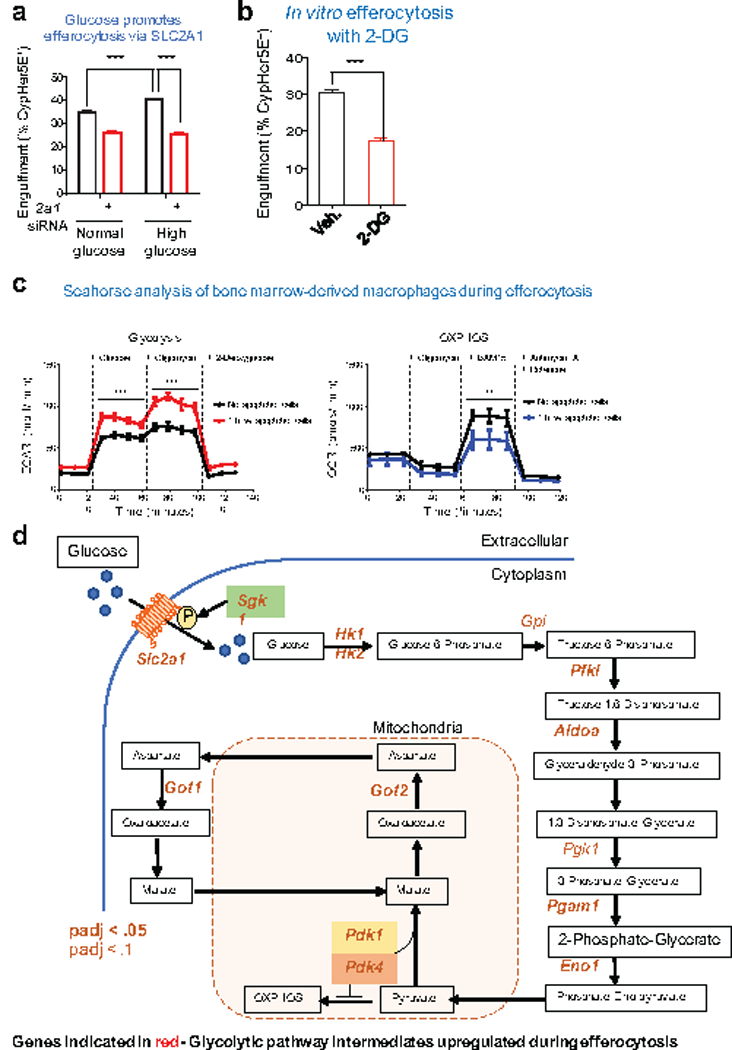
(a) The effect of physiological (1 mg/ml) or high (5mg/ml) glucose on apoptotic cell engulfment (2 h) in control and Slc2a1 siRNA-treated LR73 cells. Note that the enhanced engulfment due to higher glucose levels is lost in siRNA treated conditions. ***p < .001. Data are representative of at least three independent experiments with 3–4 replicates per condition.
(b) Apoptotic cell engulfment by LR73 cells in the presence of the glucose analog 2-DG (10mM). ***p < .001. Data are representative of two independent experiments with 2–3 replicates per condition.
(c) Bone marrow-derived macrophages undergo glycolytic flux during apoptotic cell clearance. Glycolytic flux and oxidative phosphorylation were measured during engulfment assays using Seahorse XF to assess extracellular acidification (ECAR, left panel) and oxygen consumption rates (OCR, right), respectively. Data are shown as mean +/− SD for ECAR (mpH/min) and OCR (pmol/min) over the course of standard glycolytic flux tests and cellular respiration tests. Data are representative of four replicates per condition. **p < .01, ***p < .001.
(d) Genes within the glycolytic pathway that are significantly upregulated during apoptotic cell clearance. Shown is schematic of the glycolytic pathway and subsequent steps, with the enzymes that are significantly upregulated (determined via RNAseq) indicated in red.