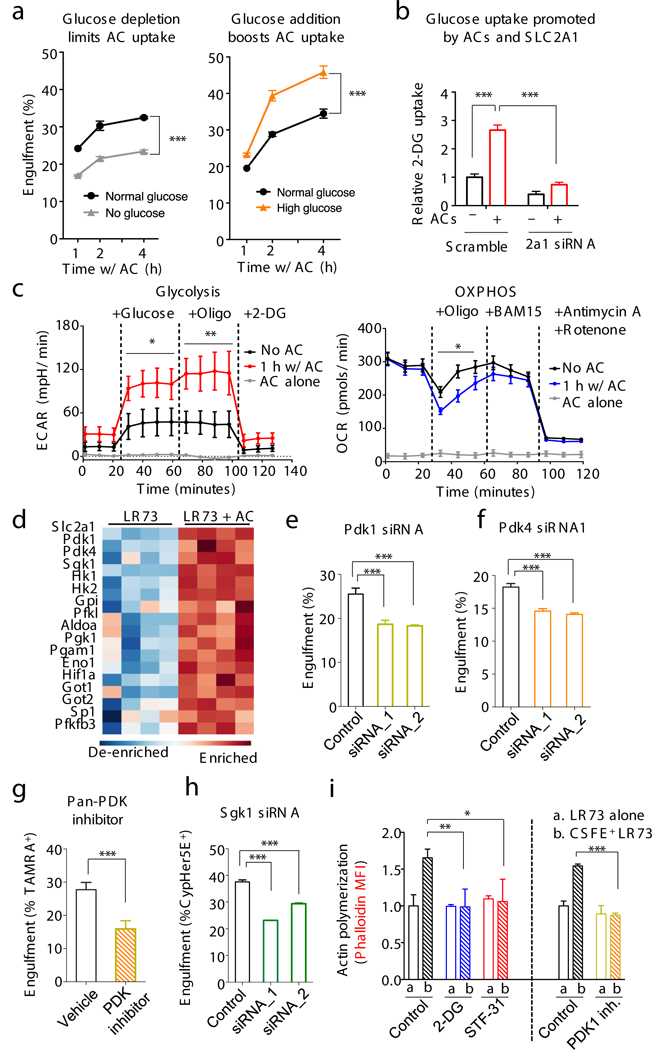
Figure 4. Glycolytic pathway intermediates facilitate efferocytosis.

(a) Efferocytosis is affected by media glucose concentration. Physiological glucose (1mg/ml, black), no glucose (grey), or high glucose (5mg/ml, orange). Glucose was supplemented when apoptotic cells were added. ***p < .001. Data from ≥3 independent experiments with 2–3 replicates per condition. (note: this differs from long-term glucose-free pretreatment of phagocytes11). (b) Increased glucose uptake via SLC2A1 during efferocytosis. LR73s were co-cultured with apoptotic Jurkat cells (2hr), washed, and 2-DG uptake measured. ***p < .001. Data from two independent experiments with 3 replicates each. (c) Phagocytes increase glycolysis during apoptotic cell clearance. Glycolysis and oxidative phosphorylation were measured during efferocytosis (with Seahorse XF) via extracellular acidification (ECAR, mpH/min) and oxygen consumption (OCR, pmol/min) rates. Mean+/−SD is shown. Two replicates per condition in two independent experiments. *p < .05, **p < .01. (d) Heatmap showing upregulation of glycolysis-associated genes during efferocytosis. (e-h) Effect of siRNA targeting of Pdk1, Pdk4 or Sgk1 in LR73 cells (e, f, h) or pan-PDK inhibitor (g) on efferocytosis. ***p< .001. Data represent three independent experiments with 3–4 replicates per condition. (i) F-actin formation during efferocytosis. LR73 phagocytes were mixed with CFSE-labeled apoptotic thymocytes (30min), stained with phalloidin (F-actin), and assessed by flow cytometry (MFI shown). PDK1 inhibitor data were performed separately. *p < .05, **p < .01, ***p < .001. Data represent ≥3 independent experiments with 3–4 replicates.
