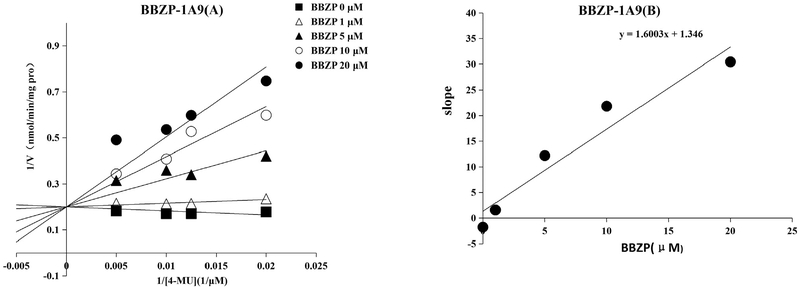
Fig. 6.
Inhibition kinetics of BBZP on UGT1A9. (A) Lineweaver-Burk plot of the inhibition of BBZP on the activity of UGT1A9. Each data point represents the mean value of duplicate experiments. (B) Determination of inhibition kinetic parameter (Ki) of BBZP on the activity of UGT1A9. The verticle axis represents the slopes of the lines from Lineweaver-Burk plot, and the horizontal axis represents the concentrations of BBZP.

