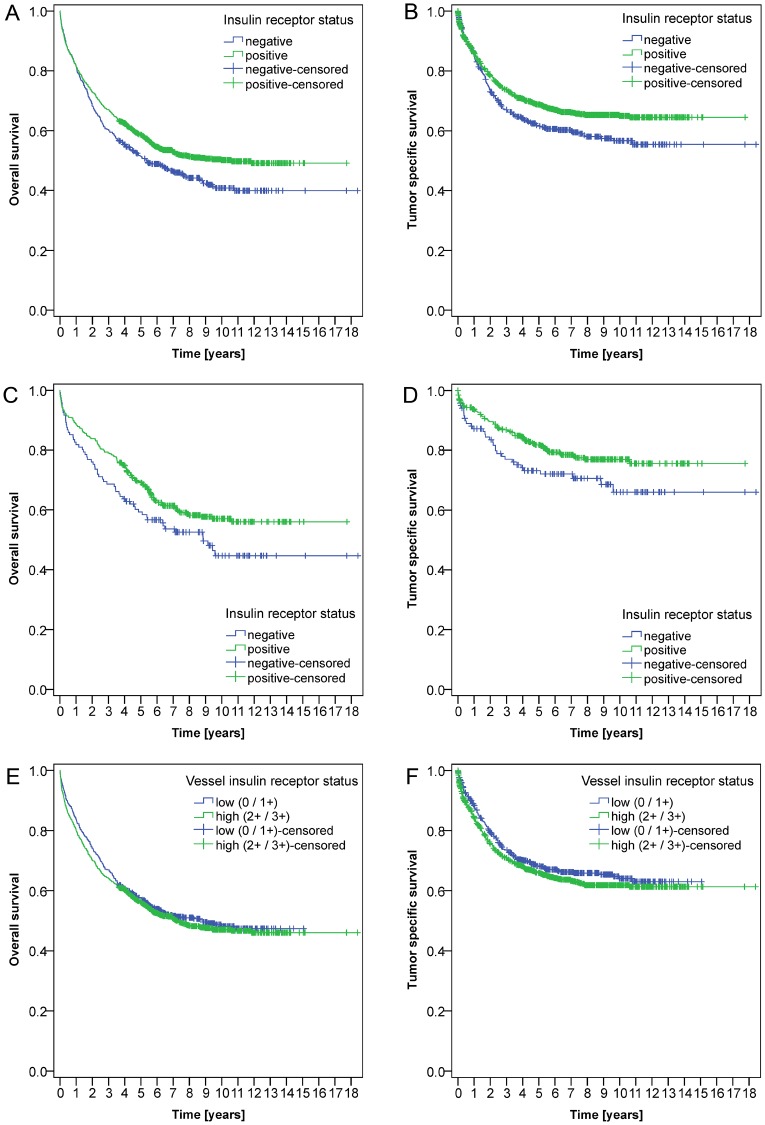
Figure 4. Kaplan-Meier curves.
Kaplan-Meier curves depict significant correlations between the expression of the insulin receptor in tumor cells (EIR) and overall (A; P = 0.007) and tumor specific survival (B; P = 0.011) in the entire cohort. Furthermore, patients without epithelial IR expression (EIR-negative) showed a worse prognosis in UICC stage II CRC with respect to overall (C; P = 0.043) and tumor specific survival (D; P = 0.045). Vascular IR expression (VIR) was not associated with overall (E, P = 0.414) or tumor specific survival (F, P = 0.205).

