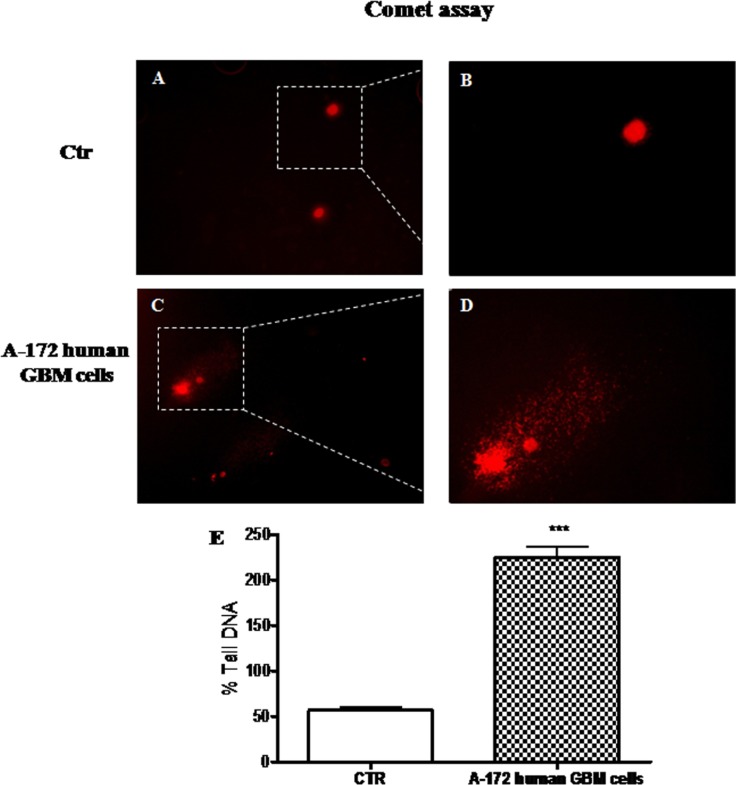
Figure 4. The role of DNA damage in GBM human cell lines.
Comet assay on GBM human cell lines. Significant increase in the % tail DNA pattern in A-172 human GBM cells (C and D, see % Tail DNA graph E), respect to NHA cells used as control, with an intact heads (A and B, see % Tail DNA graph E). Each data are expressed as mean ± SEM. T-test followed by unpaired test. ***p < 0.001 vs Ctr.

