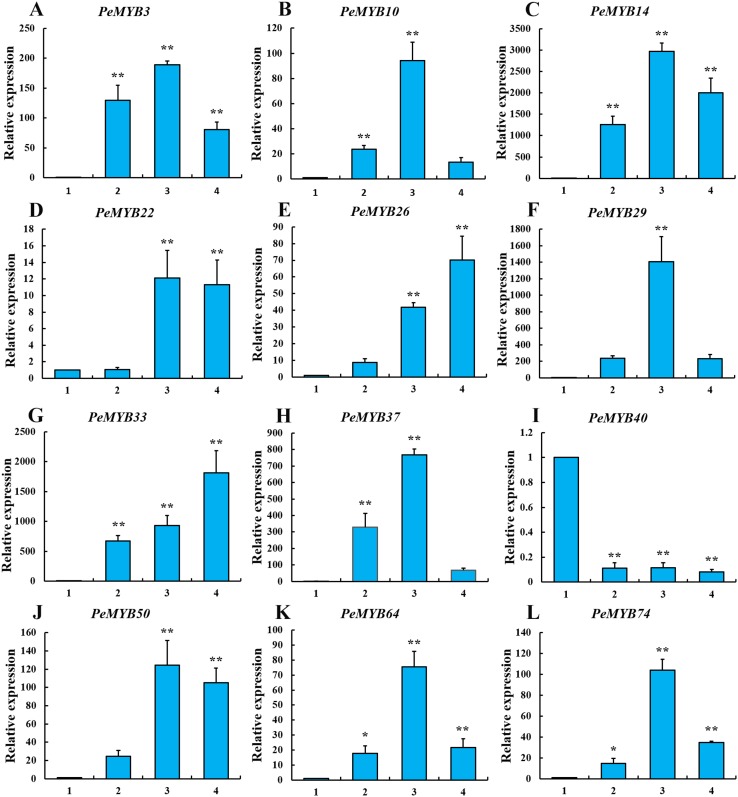
Figure 5. Expression analysis of 12 PeMYBs using qRT-PCR.
PeTIP41 was used as the reference gene. Average and error bars represent standard deviation of three biological replicates. Asterisks indicate a significant difference between the higher shoots and the 0.2 m shoots (*p < 0.05, **p < 0.01). (A) PeMYB3, (B) PeMYB10, (C) PeMYB14, (D) PeMYB22, (E) PeMYB26, (F) PeMYB29, (G) PeMYB33, (H) PeMYB37, (I) PeMYB40, (J) PeMYB50, (K) PeMYB64 and (L) PeMYB74. 1: 0.2 m shoots; 2: 1.0 m shoots; 3: 3.0 m shoots; 4: 6.7 m shoots.

