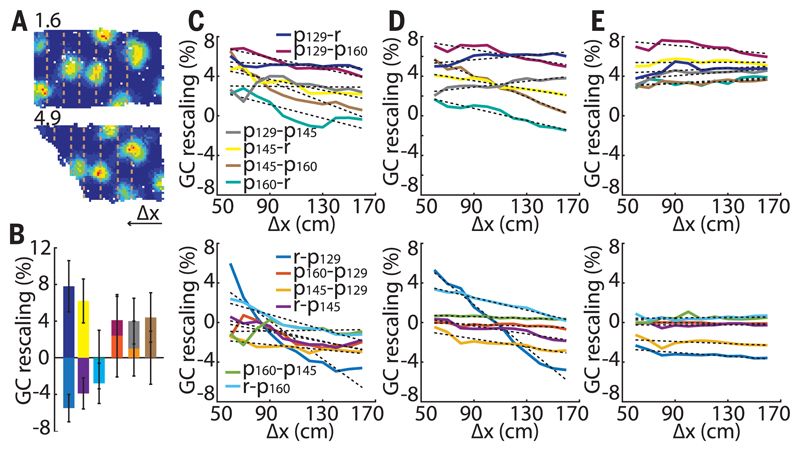
Fig. 2. Uniform versus nonuniform grid rescaling.
(A) A typical grid cell with larger changes close to the slanting wall. Dashed lines indicate matched successive increments from right to left in exposed areas for homogeneity analysis. (B) Average grid rescaling in different transformations. Different colors represent different transformations specified in (C). (C) Average grid rescaling in x direction. (D and E) Simulated grid rescaling with nonuniform (D) and uniform (E) grid rescaling.

