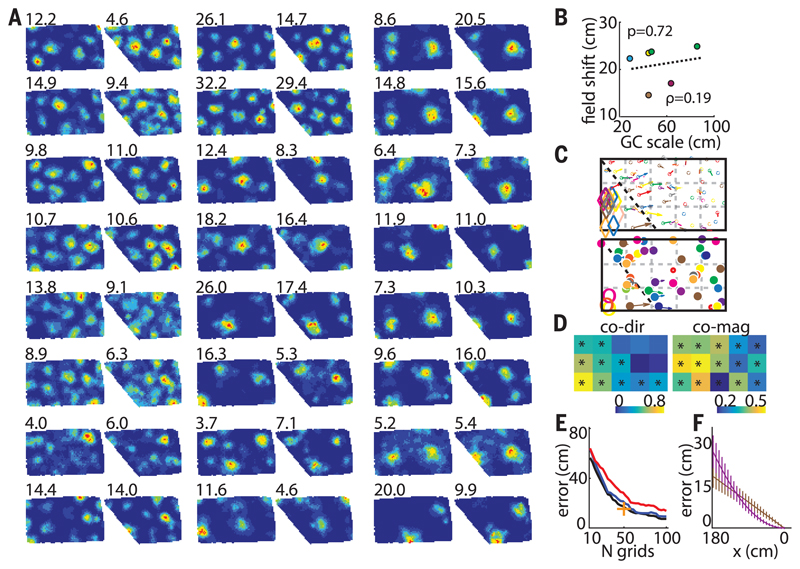
Fig. 3. Simultaneous changes in grid field positions.
(A) Twenty-four corecorded grid cells (R2405) from two different modules (ratio ~1.6). (Top left) Peak firing rate. (B) Maximum average field shifts versus grid scale of six different grid modules (five rats). Individual animals are shown with different colors (green, R2405). (C) Vector fields of cells in (A). (Top and bottom) Smaller and larger modules, respectively. Different colors correspond to different cells. Diamonds and open circles indicate fields that disappeared in poly 129°. (D) Similarity matrices of field shift directions (left) and magnitudes (right) between corecorded grid cells from five rats combined (R2405, R2383, R2338, R2375, and R2298). All transformations from poly 129° to a rectangle (and vice versa) and poly 145° to a rectangle (and vice versa) were included. GC-GC direction and magnitude similarity thresholds: 0.20 and 0.16, respectively. (E) Position decoding error decreases with the number of cells and is smaller in grids nonuniformly transformed in register (blue) compared with uncoupled ones (red). Black indicates decoding in the absence of any transformation; + indicates decoding accuracy of our largest data set (50 simultaneously recorded grid cells). (F) Systematic position decoding error is larger in nonuniformly (violet) compared with uniformly (brown) transformed grid cells close to the slanting wall. The tendency reverses close to the stable east wall.

