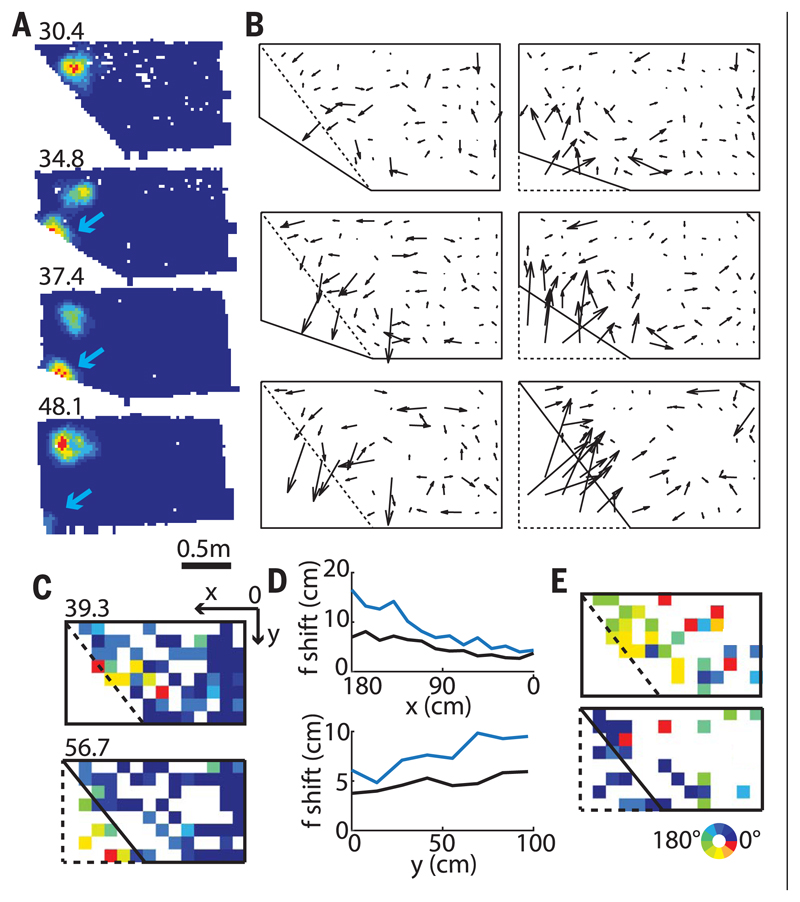
Fig. 4. Local changes in place fields.
(A) Representative place cell with one of its fields shifting with the slanting wall while a second more distant field remains stable. (Top left) Peak firing rate. (B) Mean vector fields indicating the average place-field shifts between successive pairs of different geometrical enclosures. (C) Color-coded map showing the range of vector magnitudes. First and second enclosures are shown in dashed and solid lines, respectively. (Top left) Peak shift in cm. (D) Mean field shifts in all transformations (place cells, blue; grid cells, black) in x (top) and y (bottom) directions were more pronounced in place cells compared to grid cells, with the difference larger close to the slanting wall. (E) Color-coded map showing the range of vector directions.

